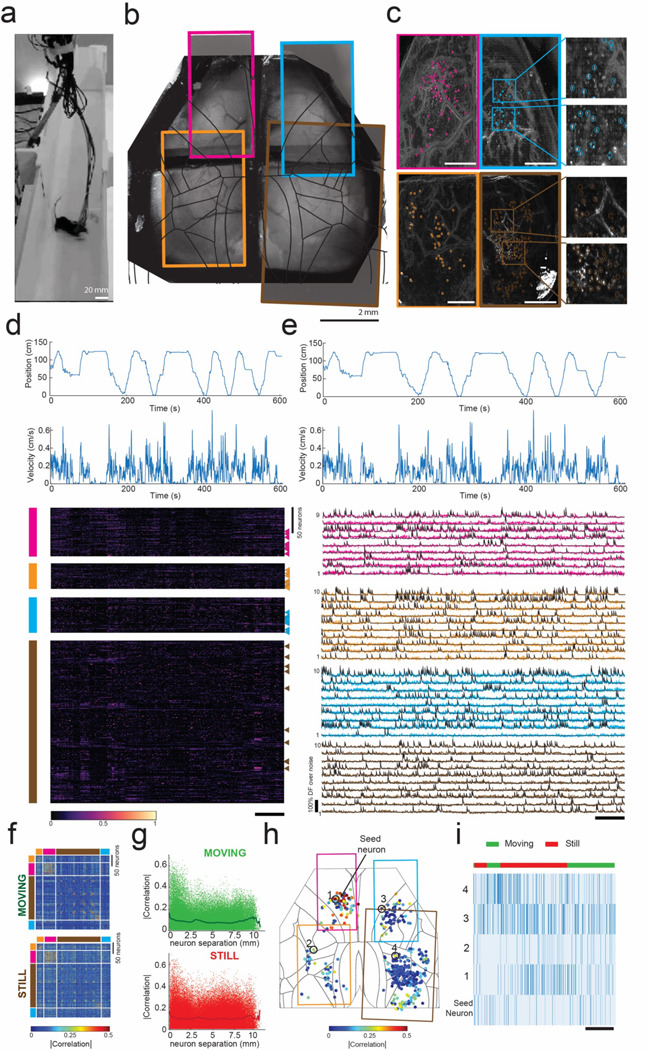
Figure 4: Cortex-wide mini-MCAM imaging in freely behaving animals:

(a) Photograph of a freely moving mouse with mini-MCAM in a linear track arena.
(b) A brightfield image of the mouse brain surface with the cranial window implant overlaid with the four FOVs captured using the mini-MCAM. Colored rectangles denote the position of the camera FOV.
(c) Background subtracted max projection images for each FOV shown in (b). Circles indicate each cell detected using the cell extraction algorithm, insets. Scale bars indicate 1 mm.
(d) The position and velocity x-direction aligned with the heatmap of the normalized z-scored DF/F traces for all cells detected in each window. colored vertical bars indicate FOV they were recorded from. triangles indicate the cells whose activity traces are shown in (e). Scale bar indicates 60 seconds.
(e) Calcium activity traces from randomly selected neurons from each FOV. Scale bar indicates 60 s.
(f) Spearman’s correlation coefficient matrices of cell-cell correlation during a 10-minute trial during epochs of movement and stillness.
(g) Spearman’s correlations for each individual cell with respect to all cells recorded as a function of inter-neuron distance.
(h) Spearman’s correlations for each individual cell with respect to a seed neuron denoted as an enlarged solid red circle. Colored rectangles indicate the borders of the imaged FOVs.
(i) Raster plots of inferred spiking of the seed neuron and 4 randomly selected neurons indicate in (h). Scale bar indicates 25 s.
