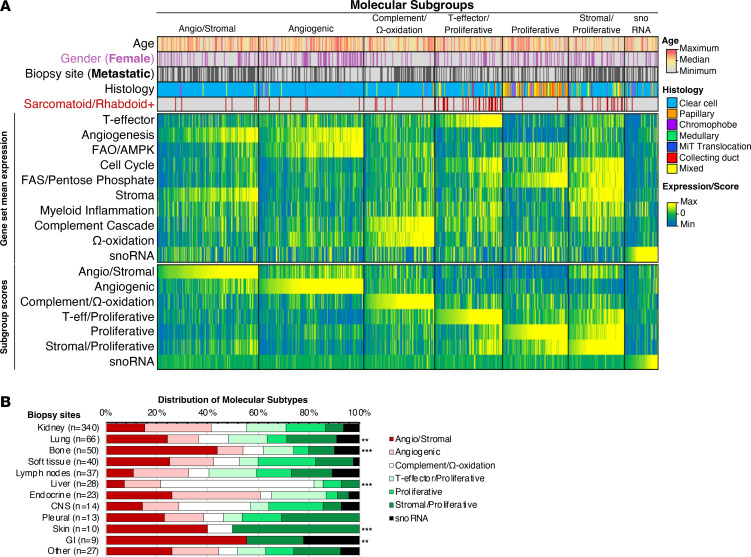
Figure 4. Sites of metastases have distinct distributions of molecular subtypes.
(A) Heatmap of patient age, gender, tumor histology, average gene set expression levels, and molecular subgroup composite scores, with patient samples sorted in ascending order (left to right) of composite scores for each subgroup. (B) Distribution of molecular subtypes by organ site. **P < 0.01 and ***P < 0.001 when compared with kidney. FAO, fatty acid oxidation; AMPK, AMP-activated protein kinase; FAS, fatty acid synthesis; GI, gastrointestinal; MiT, Microphthalmia transcription factor.

