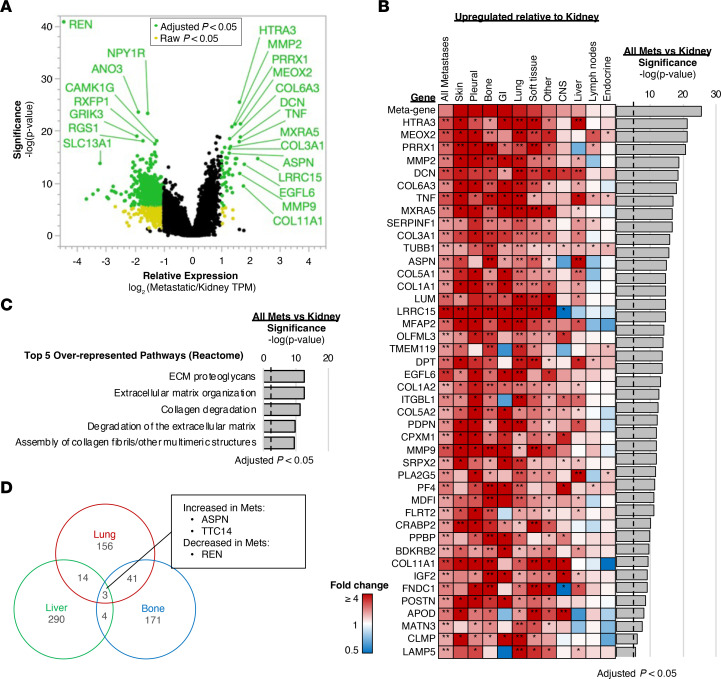
Figure 5. Gene expression profiling of metastatic and kidney biopsy sites.
(A) Volcano plot of relative gene expression of all metastatic samples compared with kidney. Colored data points indicate log2 (fold changes) ≥ 1 or ≤ –1 and raw (yellow) or adjusted (green) P value < 0.05. (B) Expression of genes significantly upregulated in panel A for each metastatic site relative to kidney. *Raw P < 0.05, **Adjusted P < 0.05. (C) Pathway analysis of the significantly upregulated genes in panel A, with the top 5 over-represented pathways from Reactome database shown. (D) Venn diagram representing differentially expressed genes for lung, bone, and liver sites compared with kidney. met, metastases; GI, gastrointestinal.

