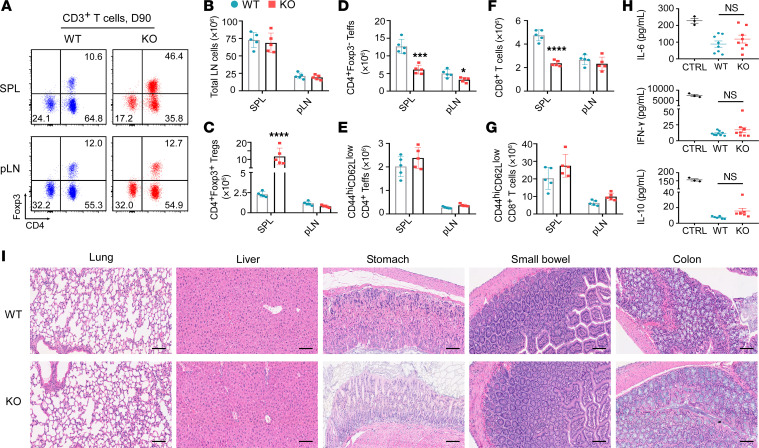
Figure 2. Treg-specific gp96 deletion preserves immune homeostasis in mice.
Both WT and KO mice received a 10-day tamoxifen treatment (days –10 to 0). Ninety days later (D90), the mice were euthanized and specified tissues were collected for analysis. (A) Representative flow plots illustrate the distribution of CD3+ T cell subsets in murine SPLs and pLNs from both groups (n = 5/group), with values indicating the percentages of the specified subsets in total CD3+ T cells. (B–G) Absolute numbers of total lymphocytes (total LN cells) (B), CD4+Foxp3+ Tregs (C), CD4+Foxp3– Teffs (D), CD44hiCD62LloCD4+ Teffs (E), CD8+ T cells (F), and CD44hiCD62LloCD8+ T cells (G) in SPLs and pLNs from mice of both groups. (H) Serum levels of IL-6, IFN-γ, and IL-10 were measured on day 90 following tamoxifen administration (days –10 to 0) in WT and KO mice using ELISA. n = 6–9/group. CTRL, positive control. (I) Representative H&E-stained images of the indicated organs from WT and KO mice (day 90; n = 5–8/group). Scale bars: 100 μm. Results are representative of more than 3 independent experiments. Data are shown as the mean ± SEM. *P < 0.05, ***P < 0.001, and ****P < 0.0001 (KO vs. WT). For statistical analyses, a 2-tailed, unpaired Student’s t test was performed (B–H).

