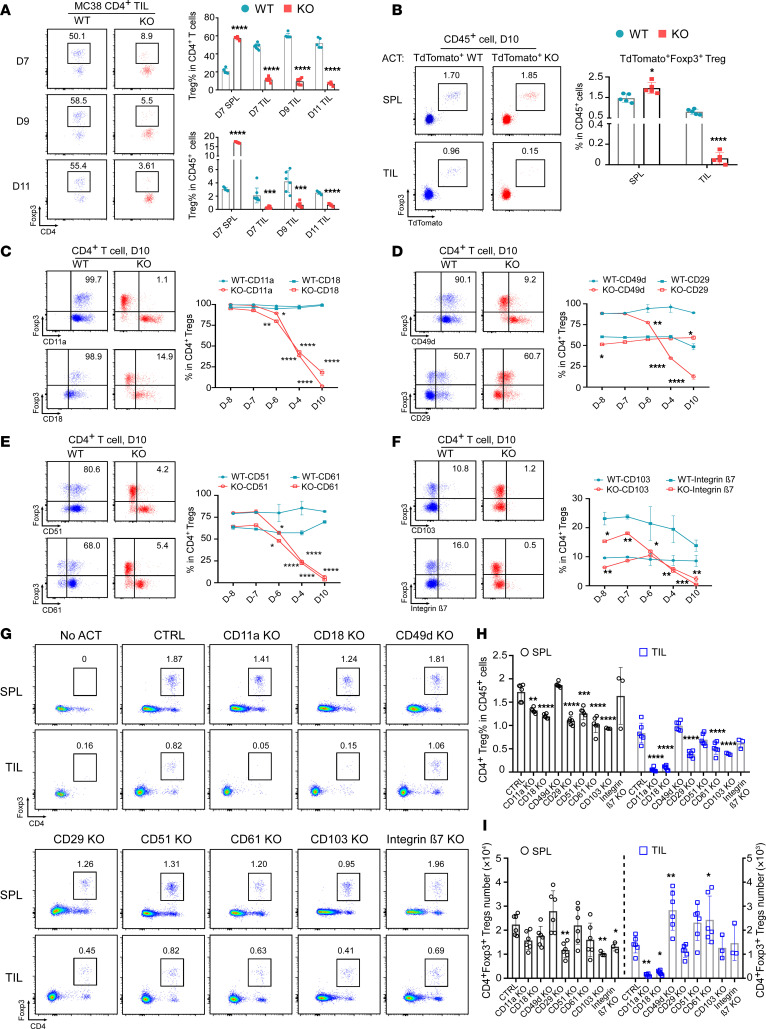
Figure 3. Gp96 regulates CD11a/CD18 (LFA-1) integrin expression in Tregs and facilitates their infiltration into the TME.
(A) WT and KO mice (n = 5–8/group) were pretreated with tamoxifen (days –10 to 0) and s.c. implanted with MC38 tumors on day 0. TILs were harvested on days 7, 9, and 11. Representative flow cytometric plots and summary graphs show the percentages of CD4+Foxp3+ Tregs in specified tissues at these time points. (B) Rag2–/– recipient mice (n = 5/group) were implanted s.c. with 2 × 10⁶ MC38 cells on day 0. TdTomato-expressing Tregs from SPLs of R26STOP-tdTomato Foxp3eGFP-Cre-ERT2 Hsp90b1WT/WT (TdTomato-WT) or R26STOP-tdTomato Foxp3eGFP-Cre-ERT2 Hsp90b1fl/fl (TdTomato-KO) donor mice were collected, preactivated, and transferred (2 × 10⁶ cells/mouse; n = 5/group) into recipient mice on day 3. On day 10, SPLs and tumors were harvested for flow cytometry. Representative flow cytometric plots and summary graphs indicate the percentages of infiltrating TdTomato+Foxp3+ Tregs among CD45+ cells. (C–F) WT and KO mice (n = 3/group) received tamoxifen (days -10 to 0), and splenic Tregs’ integrin expression was assessed using flow cytometry at designated time points (D–8, day –8; D–7, day –7; D–6, day –6; D–4, day –4; D10, day 10). Representative flow cytometric plots (day 10) and summary graphs (time course) show frequencies of indicated surface integrins on splenic Foxp3+ Tregs in WT and KO mice. (G–I) Naive CD4+ T cells from SPLs of C57BL/6 mice were differentiated into iTregs under Treg-skewed conditions for 2 days (days –2 to 0) followed by CRISPR/Cas9 KO of indicated integrins on day 0; cells were cultured for 3 more days (days 0–3). MC38 tumor–bearing Rag2–/– mice (n = 3–6/group) received specific integrin-KO or nontargeting control iTregs on day 3 post-tumor implantation; SPLs and tumors were collected on day 10 for flow cytometry. Representative flow cytometric plots (G) and summary graph (H) show relative number of Foxp3+ Tregs (in CD45+ cells total). (I) Absolute numbers of Tregs in SPLs and TILs. Results represent 3 independent experiments. Data indicate the mean ± SEM. *P < 0.05, **P < 0.01, ***P < 0.001, and ****P < 0.0001 (KO vs. WT), by 2-tailed Student’s t test used for comparisons of different experimental groups (A–F) and 1-way ANOVA with Dunnett’s multiple-comparison test for multiple-comparison analyses (H and I).

