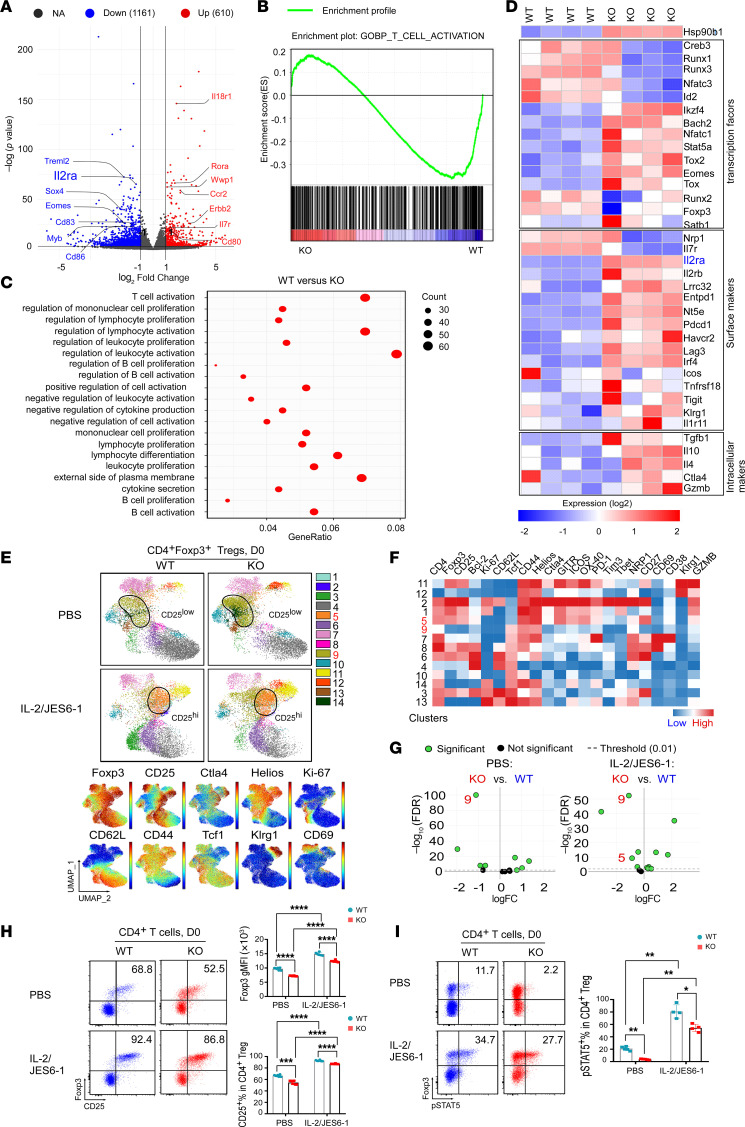
Figure 5. Gp96 deletion in Tregs reduces their CD25 expression but preserves their responsiveness to IL-2/p-STAT5 signaling activation.
(A) Volcano plot depicting DEGs in splenic Tregs from KO versus WT mice after 10-day tamoxifen treatment (days –10 to 0; n = 4/group). The x axis indicates log2 fold change, and the y axis represents –log10 (corrected P value). Gray dots (NA) indicate no significant difference; blue dots (down) indicate downregulated genes in KO Tregs (adjusted P < 0.05; Ilr2a highlighted); red dots (up) indicate upregulated genes (adjusted P < 0.05). (B) GSEA of T cell activation genes between gp96-KO and WT Tregs shows FDR q = 0.03 and NES = –1.45. (C) GO enrichment scatter plots show the top 20 enriched pathways for DEGs in WT vs. gp96-KO Tregs, with dot size representing gene counts and GeneRatio indicating DEG ratios. (D) Heatmap of relative expression of selected genes encoding transcription factors, surface markers, and intracellular molecules in Tregs from WT and KO mice. Red indicates a high expression level; blue indicates a low expression level. Expression of Ilr2a (highlighted in blue) was significantly downregulated in gp96-KO Tregs. (E) UMAP visualization of splenic Tregs from WT and KO mice (top; n = 6–7/group). Mice received either PBS or IL-2/JES6-1 complex at specific time points, concurrently with tamoxifen treatment (days –10 to 0). Cluster 5 (CD25hi Tregs) and cluster 9 (CD25lo Tregs) were enriched in gp96-KO Tregs (highlighted in red). (F) Heatmap shows marker expression levels by cluster, with clusters 5 and 9 highlighted. (G) edgeR analysis indicates clusters significantly altered in splenic Tregs from WT (right) versus KO (left) mice receiving PBS or IL/JES6-1. Clusters 5 and 9 are highlighted. (H) Representative flow cytometric plots and summary graphs depict Foxp3 and CD25 expression in splenic Tregs from WT and KO mice on day 0, as described in E. Numbers indicate the frequencies of CD25+ subset in Foxp3+ Tregs. (I) Representative flow cytometric plots and graph depicting the ex vivo levels of p-STAT5 in splenic Tregs from WT and KO mice (n = 4–5/group) on day 0, as described in E. Numbers indicate frequencies of the p-STAT5+ subset in Foxp3+ Tregs. Results represent 3 independent experiments. Data are shown as the mean ± SEM. *P < 0.05, **P < 0.01, ***P < 0.001, and ****P < 0.0001, by 1-way ANOVA with Dunnett’s T3 multiple-comparison test (H and I).

