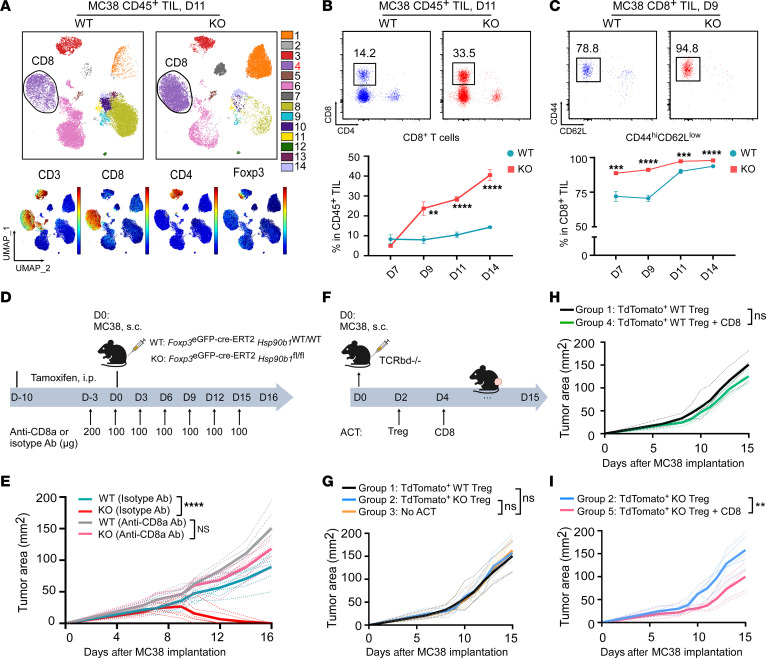
Figure 6. Upon gp96 deletion, the absence of infiltrating Tregs promotes CD8+ TIL accumulation and activation, leading to repression of MC38 tumors.
(A) Spectral flow cytometric analysis of CD45+ TILs collected from day-11 MC38 tumors (implanted at 2 × 10⁶ cells on day 0) from WT and KO mice pretreated with tamoxifen (days –10 to 0; n = 6/group). Cluster 4 (CD8+ T cells; highlighted in red) expressing both CD3 and CD8 was significantly enriched in KO mice. Expression distribution of the indicated markers is shown in the bottom plots. (B) Representative flow cytometric plots (day 11) and summary graph (days 7, 9, 11, and 14) show the percentages of CD8+ T cells in CD45+ TILs from MC38 tumors from WT and KO mice (n = 5–8/group). (C) Representative flow cytometric plots (day 9) and summary graphs (days 7, 9, 11, and 14) show the frequencies of the CD44hiCD62Llo population within CD8+ TILs from MC38 tumors grown in WT and KO mice (n = 5–8/group). (D) Experimental schema depicts the administration of CD8-depleting Ab (anti-CD8a Ab) or matched isotype Ab treatment in MC38 tumor–bearing WT and KO mice (2 × 10⁶ MC38 cells/mouse, s.c.; n = 6–7/group) that received tamoxifen before treatment (days –10 to 0). (E) Tumor growth curves of MC38 cells grown in WT and KO mice receiving anti-CD8a or isotype Ab treatment. (F) Experimental schema outlines the ACT of TdTomato+ WT or KO Tregs and/or CD8+ T cells into Tcrbd–/– mice (recipient) following MC38 tumor cell implantation (0.6 × 10⁶ cells, s.c.). TdTomato+ WT or gp96-KO Tregs from SPLs of TdTomato+ WT and TdTomato+ KO donor mice were isolated, preactivated, and adoptively transferred into mice bearing day-2 MC38 tumors. In parallel, CD8+ T cells were isolated from dLNs of C57BL/6 mice bearing day-12 MC38 tumors, stimulated in vitro for 3 days, and transferred into recipient mice on day 4. (G–I) MC38 tumor growth curves among the indicated 5 groups of mice (n = 4–7/group). Results are representative of 3 independent experiments. Data are shown as the mean ± SEM. **P < 0.01, ***P < 0.001, and ****P < 0.0001 (KO vs. WT), by 2-tailed Student’s t test for comparisons of different experimental groups where multiple comparisons were not performed (B and C) and repeated-measures 2-way ANOVA for analysis of tumor growth curves (E, H and I).

