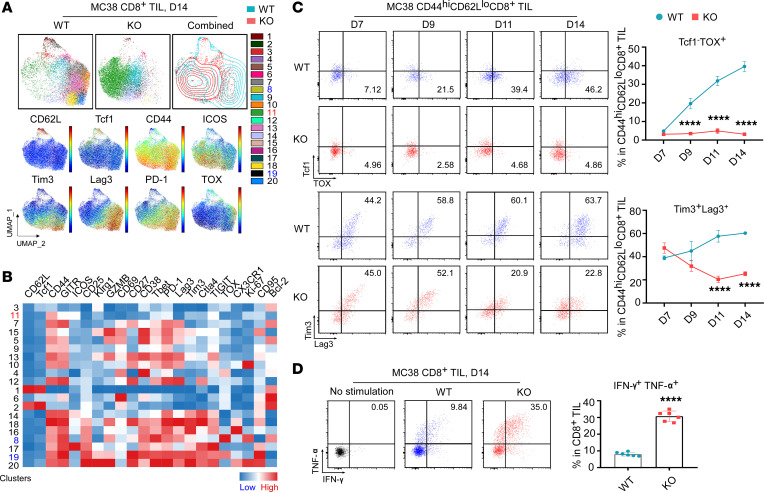
Figure 7. Upon gp96 deletion, the lack of infiltrating Tregs inhibits TOX-mediated CD8+ TIL exhaustion in MC38 tumors.
(A) Spectral flow cytometric analysis of CD8+ TILs collected from day-14 MC38 tumors grown in WT and KO mice (n = 7/group). Cluster 11 (CD44hiCD62LloICOS+CD8+ Teffs; highlighted in red) increased in the KO group; clusters 8 and 19 (CD44hiCD62LloTcf1–TOX+PD-1+Lag3+Tim3+CD8+ subsets; highlighted in blue) decreased in the KO group. Expression distribution of the indicated markers is shown in the bottom plots. (B) Heatmap of marker expression by cluster. (C) Representative flow cytometric plots and summary graphs compare the percentages of the Tcf1–TOX+ and Tim3+Lag3+ population within CD44hiCD62LloCD8+ TILs from day-7, -9, -11, and -14 MC38 tumors grown in WT and KO mice pretreated with tamoxifen (days –10 to 0; n = 5–8/group). (D) Representative flow cytometric plots and summary graph indicating the percentages of IFN-γ+TNF-α+ CD8+ TILs from day-14 MC38 tumors grown in WT and KO mice (n = 6/group) after a 5-hour ex vivo TCR stimulation with anti-CD3 and anti-CD28 Abs. Results are representative of more than 3 independent experiments. Data are shown as the mean ± SEM. ****P < 0.0001 (KO vs. WT), by 2-tailed Student’s t test for comparisons of different experimental groups (C and D).

