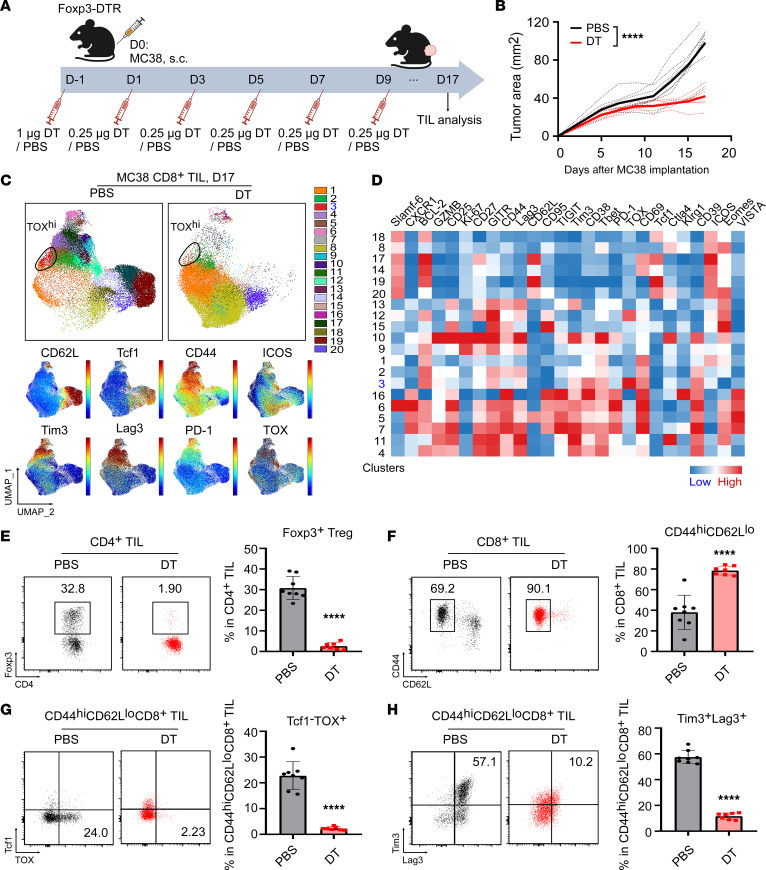
Figure 8. Depletion of Tregs attenuates TOX-mediated CD8+ TIL exhaustion in MC38 tumors from Foxp3DTR mice.
(A) Experimental schema illustrates the process of DT or PBS treatment in Foxp3DTR mice (n = 7–8/group) implanted with MC38 tumor cells (day 0; 2 × 10⁶ MC38 cells/mouse). (B) Tumor growth curves of MC38 tumor cells grown in Foxp3DTR mice receiving DT or PBS treatment. (C) Spectral flow cytometric analysis of CD8+ TILs collected from day-17 MC38 tumors grown in Foxp3DTR mice. Cluster 3 (CD44hiCD62LloTcf1–TOX+PD-1+Lag3+Tim3+CD8+ subset; highlighted in blue) decreased in the DT group. Expression distribution of the indicated markers is shown in the bottom plots. (A) Heatmap visualization of marker expression by cluster. (E–H) Representative flow cytometric plots and summary graph indicate the percentages of Foxp3+ Tregs (within CD4+ TILs) (E), the CD44hiCD62Llo population (within CD8+ TILs) (F), the Tcf1–TOX+ subset (within CD44hiCD62LloCD8+ TILs) (G), and Tim3+Lag3+ cells (within CD44hiCD62LloCD8+ TILs) (H) among groups. Results are representative of 3 independent experiments. Data are shown as the mean ± SEM. ****P < 0.0001 (DT vs. PBS), by repeated-measures 2-way ANOVA for tumor growth curves (B) and 2-tailed Student’s t test for comparisons of different experimental groups (E–H).

