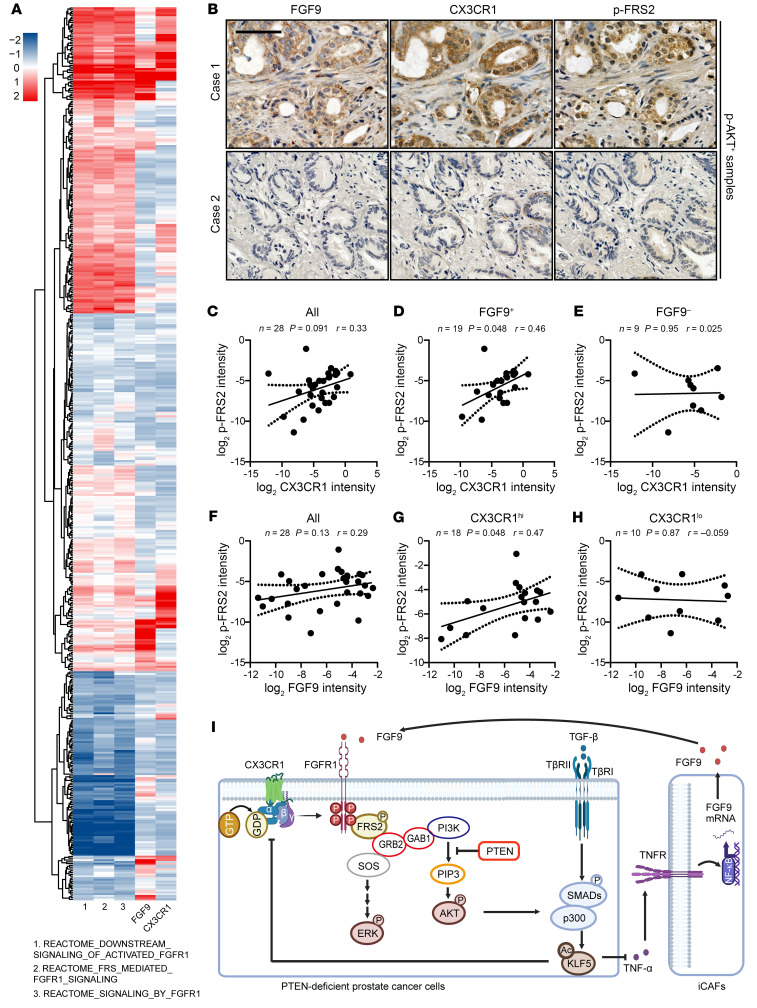
Figure 9. Higher expression levels of FGF9 and CX3CR1 correlate with the activation of FGFR1 signaling in human prostate cancer.
(A) Correlation of FGF9 and CX3CR1 with FGFR1 activation in prostate cancer samples from TCGA database. ssGSEA was used to identify FGFR1 activation for 499 cancer samples using 3 different REACTOME gene sets. The gene expression levels of FGF9 and CX3CR1 were normalized into a z score. (B) Representative images of IHC staining of FGF9, CX3CR1, and p-FRS2 in p-AKT+ prostate cancer samples. Scale bar: 50 μm. (C–E) In p-AKT+ tumors, the expression levels of CX3CR1 and p-FRS2 were positively correlated in FGF9+ conditions. All, all p-AKT+ tumors (C); FGF9+, FGF9+/p-AKT+ tumors (D); FGF9–, FGF9–/p-AKT+ tumors (E). (F–H) In p-AKT+ tumors, the expression levels of FGF9 and p-FRS2 are positively correlated in the condition of CX3CR1hi. All, all p-AKT+ tumors (F); CX3CR1hi, CX3CR1hi/p-AKT+ tumors (G); CX3CR1lo, CX3CR1lo/p-AKT+ tumors (H). The definition of the expression levels of p-AKT, FGF9, and CX3CR1 refer to Supplemental Table 1. *P < 0.05, by Pearson analyses (C–H). (I) Schematic depicting how PTEN deficiency–induced KLF5 acetylation constrains prostate cancer progression by attenuating FGFR1 activation via CAF reprogramming. This illustration was generated using BioRender (publication agreement no. CZ26N14CEQ).

