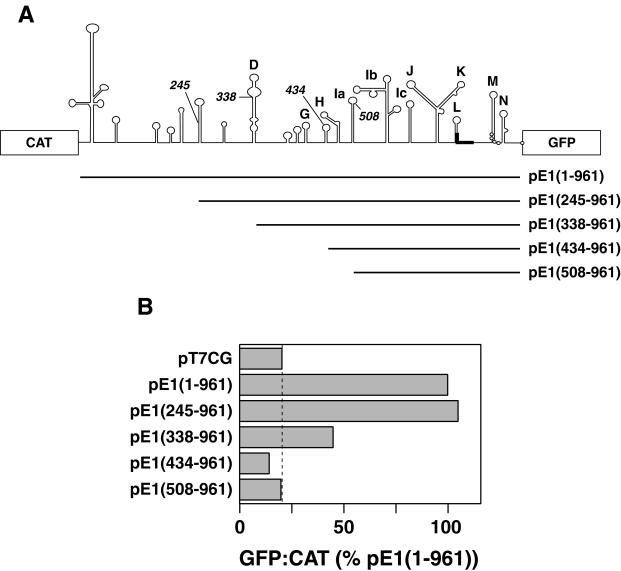
FIG. 3.
Functional analysis of the ERAV IRES using a bicistronic plasmid. (A) Diagram showing the ERAV AgeI fragments ligated into plasmid pT7CG between the CAT and GFP reporter genes. The names of the plasmids are indicated to the right, and the numbering begins from the poly(C) tract. (B) GFP-to-CAT ratios in VTF7-3-infected BHK-21 cells (expressing T7 RNA polymerase) following transfection with the plasmids shown at the left. GFP fluorescence was measured by FACS analysis of whole cells, while CAT enzyme activity was determined from cell extracts as detailed in Materials and Methods. Values are represented as a percentages of the  ratio determined for pE1(1–961). The dashed vertical line indicates the value obtained for the GFP negative control plasmid pT7CG.

