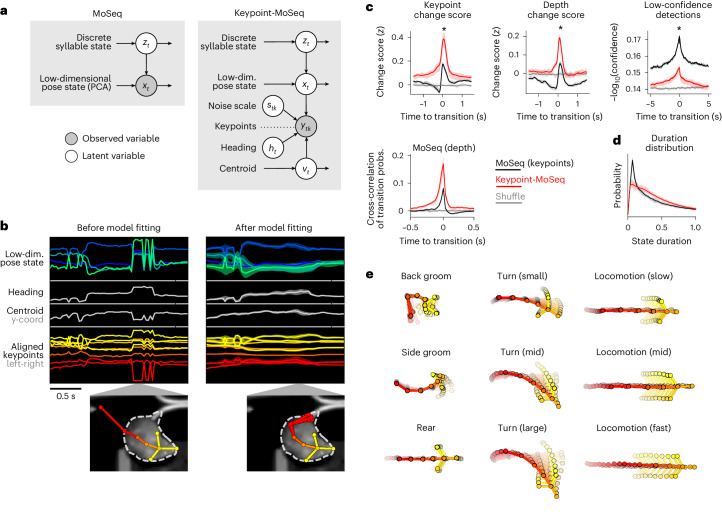
Fig. 2. Hierarchical modeling of keypoint trajectories decouples noise from pose dynamics.
a, Graphical models illustrating traditional MoSeq and keypoint-MoSeq. In both models, a discrete syllable sequence governs pose dynamics in a low-dimensional pose state; these pose dynamics are either described using principal component analysis (PCA; as in ‘MoSeq’; left) or inferred from keypoint observations in conjunction with the animal’s centroid and heading, as well as a noise scale that discounts keypoint detection errors (as in ‘keypoint-MoSeq’; right). b, Example of error correction by keypoint-MoSeq. Left: before fitting, all variables (y axis) are perturbed by incorrect positional assignment of the tail-base keypoint (whose erroneous location is shown in the bottom inset). Right: Keypoint-MoSeq infers plausible trajectories for each variable (shading represents the 95% confidence interval). The inset shows several likely keypoint coordinates for the tail-base inferred by the model. c, Top: various features averaged around syllable transitions from keypoint-MoSeq (red) versus traditional MoSeq applied to keypoint data (black), showing mean and inter-95% confidence interval range across N = 20 model fits. Bottom: cross-correlation of syllable transition probabilities between each model and depth MoSeq. Shaded regions indicate bootstrap 95% confidence intervals. Peak height represents the relative frequency of overlap in syllable transitions. Differences in each case were significant (*P = 2 × 10⁻⁷ over N = 20 model fits, Mann–Whitney U test). d, Duration distribution of the syllables from each of the indicated models. Shading as in c. e, Average pose trajectories for example keypoint-MoSeq syllables. Each trajectory includes ten poses, starting 165 ms before and ending 500 ms after syllable onset.

