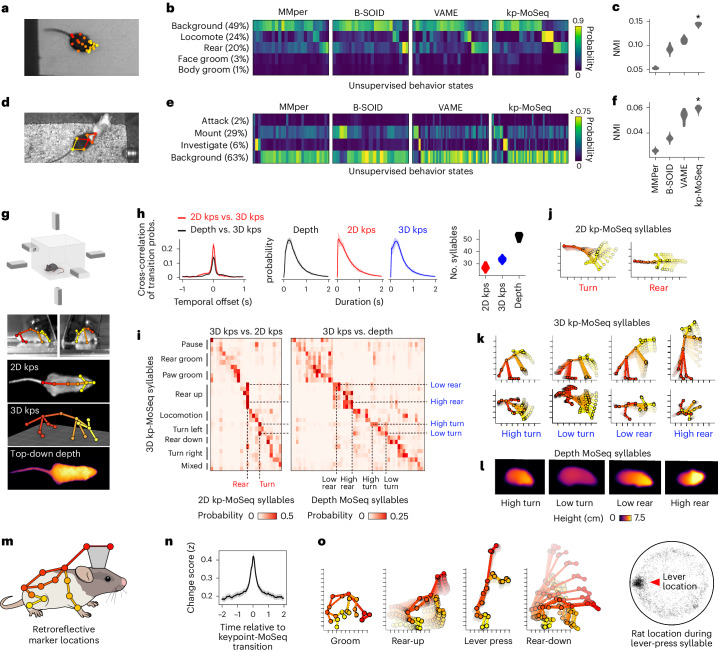
Fig. 5. Keypoint-MoSeq generalizes across experimental setups.
a, Frame from an open field benchmark dataset. b, Confusion matrices showing overlap between human-labeled behaviors and unsupervised states. c, Normalized mutual information (NMI) between supervised and unsupervised labels, showing the distribution of NMI values across N = 20 model fits. Keypoint-MoSeq consistently had higher NMI (*P < 10−6, Mann–Whitney U test). d, Frame from the CalMS21 social behavior benchmark dataset, showing 2D keypoints of the resident mouse. e,f, Comparison between human labels and unsupervised behavior states of the resident mouse, as in b and c (P < 10−5, Mann–Whitney U test). g, Multi-camera arena for simultaneous recording of 3D keypoints (3D kps), 2D keypoints (2D kps) and depth videos. Figure created with SciDraw under a CC BY 4.0 license. h, Comparison of MoSeq outputs from each modality. Left: cross-correlation between 3D transition probabilities and those for 2D keypoints and depth. Shading shows bootstrap 95% confidence intervals; middle: distribution of syllable durations, showing mean and inter-95% confidence interval range across N = 20 model fits. Right: number of states with frequency > 0.5%, showing the distribution of state counts across 20 runs of each model. i, Overlap of syllables from 2D keypoints (left) or depth (right) with each 3D keypoint-based syllable. j–l, Average pose trajectories for the syllables marked in i. k, 3D trajectories are plotted from the side (first row) and top (second row). l, Average pose (as depth image) 100 ms after syllable onset. m, Location of markers for rat motion capture. Figure created with SciDraw under a CC BY 4.0 license. n, Left: average keypoint change score (z) aligned to syllable transitions. Shading shows 95% confidence intervals of the mean. Right: durations of keypoint-MoSeq states and inter-changepoint intervals. o, Left: pose trajectories of example syllables learned from rat motion capture data. Right: random sample of rat centroid locations during execution of the ‘lever-press’ syllable.

