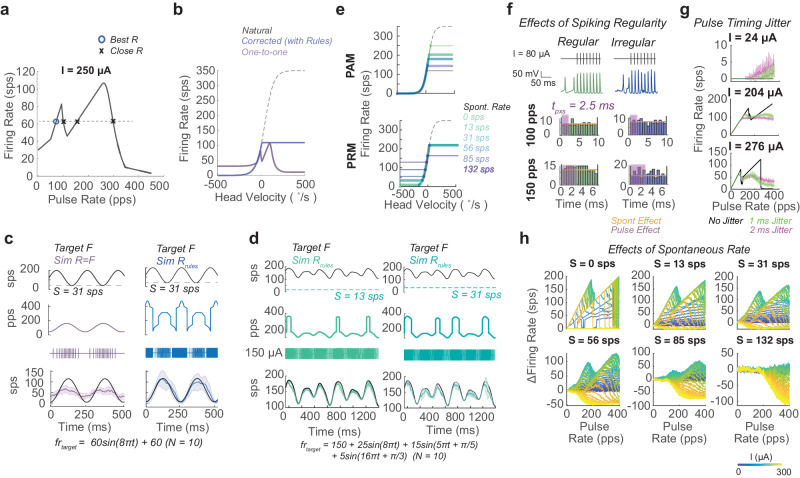
Fig. 5. Application of pulsatile effects to neural implants.
a Pulse rate-firing rate relationship at a high pulse amplitude standard for vestibular implants for an afferent with a spontaneous rate of 31 sps. Afferent used in a–c. Knowledge of this relationship can be used to predict optimal pulse rates for producing a desired firing rate. Here this is the lowest pulse rate that produces the desired firing rate (blue circle). b The natural head velocity to firing rate mapping (black dashed) compared to the standard one-to-one pulse rate mapping strategy (purple) and the corrected strategy (blue). c The target firing rate waveform (top), pulsatile waveform in pulse rate over time form and pulse sequence form (middle), and simulated responses waveform (bottom) for pulse rate modulation using the one-to-one mapping (R = F, purple) and the corrected strategy (Rrules, blue), using the equations from the paper to account for pulse effects. d The corrected strategy is applied to afferents with two different spontaneous rates (S = 13 sps green, S = 31 sps teal) for target inputs that are a mixture of sinusoids. Displayed in same format as c. Data are plotted as mean ± SEM across simulations (N = 10) in bottom of c and d. e The head velocity to firing rate mapping for a pulse amplitude modulation and pulse rate modulation strategies across afferents with different spontaneous rates. f The timing of spontaneous action potentials between pulses for regularly (green) and irregularly spiking (blue) afferents. Shown as in Fig. 3B. g The PFR at different pulse amplitudes when pulse delivery timing has a no jitter (black), 1 ms (green), or 2 ms (pink) Gaussian noise in timing. h The response of simulated afferents of different spontaneous rates (S) replotted with panel per S to emphasize the difference in the PFR at the same pulse amplitude, as amplitude increases (blue to yellow).

