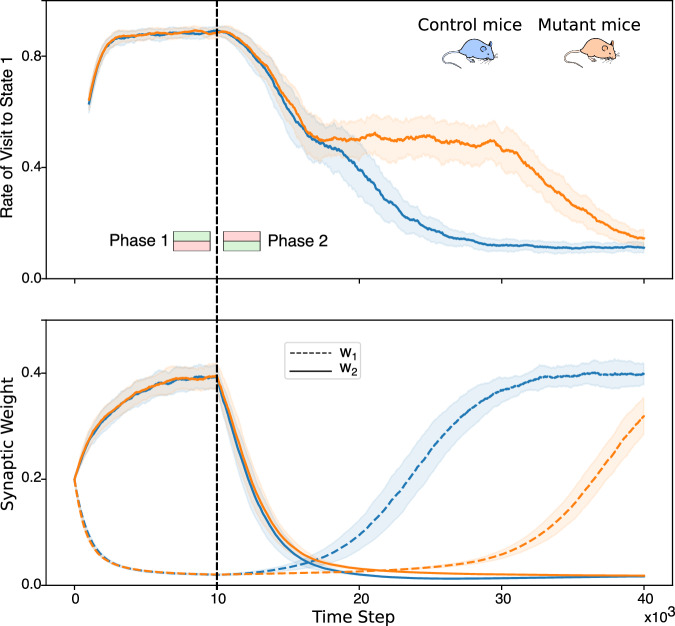
Fig. 4. The model reproduces learning deficit in mutant mice.
The figure shows the results of the simulated place-avoidance experiment (described in Fig. 3) for control mice and mutant mice. The top graph shows the rate of visit to the state S1, computed as the relative number of visits to state S1 in the last 1000 time steps. The bottom graph shows the evolution of the synaptic weights. All the curves are averages over 50 simulated mice. During the first phase of the simulation (left of the black line) the states S1 and S2 are associated with a positive and negative reinforcement signal, respectively. Coherently, the frequency of visits of the agent-mouse to state S1 increases to about 9 times out of 10. Both weights converge to a finite value, one of them close to zero, the other close to 0.4. There is no difference in learning between control mice and mutant mice. During the second phase (right of the black line), the reinforcement signals are switched. Both groups of mice learn to avoid the state S1, with a visit frequency of about 1 time out of 10. However, mutant mice show a significant delay during this phase of reverse learning. During this phase, the weights switch their values. The switching is faster in control mice (top) than in mutant mice (bottom). More precisely, the higher weight decays with the same speed in both groups, reflecting the initial drop in the visiting frequency (top figure, second phase). However, the low weight increases earlier and faster in control mice than in mutant mice.

