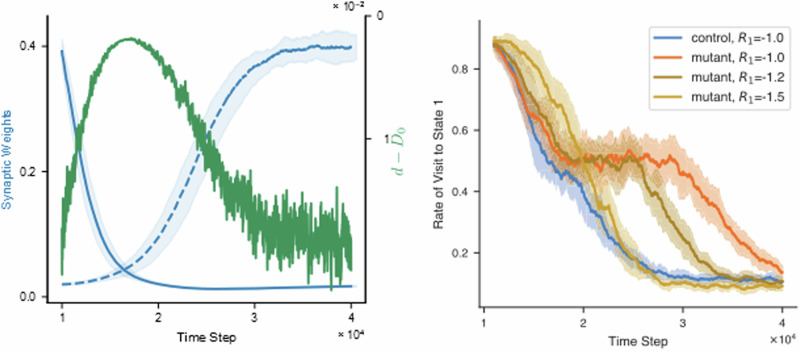
Fig. 5. (left) Increased D-serine levels during reverse learning.
The blue lines are the evolution of the two synaptic weights during reverse learning of normal mice (same lines of Fig. 4, bottom graph, second phase). The D-serine concentration relative to its maximum value D0 is superposed (green line). The scale for d − D0 is of course different from that of the synaptic weights, and it is drawn on the right axis. The D-serine levels increase during reverse learning and they return to the basal value when the switching is completed. This prediction suggests that the astrocytic regulation of D-serine has the specific function of enhancing plasticity response to changes in the external environment (possibly via increasing the opening probability of NMDAR channels). (right) Increasing the aversiveness of the stimulus recovers learning speed for mutant mice. The rate of visit to state S1 during the second phase of learning is plotted, for control mice with R1 = −1, and for mutant mice with R1 = −1, −1.2, −1.5. The mutant mice show a significant delay with respect to control, for the same values of the reinforcement variable (already discussed in Fig. 4). However, the mutant mice learn faster as the magnitude of R1 increases, and it reaches the speed of the control mice for R1 = −1.5.

