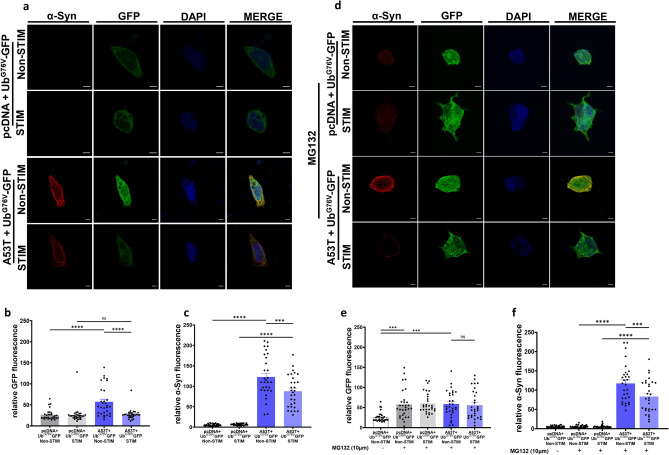
Figure 2.
α-Syn reduction due to high frequency electrical stimulation limits UPS dysfunction. (a) Representative images of SH-SY5Y cells co-transfected with UbG76V-GFP and A53T or pcDNA after stimulation for 2 h and non-stimulated controls, stained with DAPI (blue), α-Syn (red) and anti-GFP (green) (Scale bars 5 µm) (b) Quantification of GFP fluorescence levels depicting UbG76V levels in cells transfected with A53T and pcDNA controls in presence and absence of stimulation n = 3 independent experiments, analyzing 10 cells per condition. Bars represent mean ± s.e.m., ****p < 0.0001, ns non-significant. one-way ANOVA, Tukey’s m.c.t. (c) Quantification of α-Syn fluorescence in SH-SY5Y cells after stimulation for 2 h and non-stimulated controls. n = 3 independent experiments, analyzing 10 cells per condition. Bars represent mean ± s.e.m., ***p < 0.001, ****p < 0.0001 one-way ANOVA, Tukey’s m.c.t. (d) Representative images of SH-SY5Y cells co-transfected with UbG76V-GFP and A53T or pcDNA, treated with MG132, after stimulation for 2 h and non-stimulated controls, stained with DAPI (blue), α-Syn (red) and anti-GFP (green) (Scale bars = 5 µm) (e) Quantification of GFP fluorescence levels. n = 3 independent experiments, analyzing 10 cells per condition. Bars represent mean ± s.e.m., ***p < 0.001, ns non-significant, Tukey’s m.c.t. (f) Quantification of α-syn fluorescence levels. n = 3 independent experiments, analyzing 10 cells per condition. Bars represent mean ± s.e.m., ***p < 0.001, ****p < 0.0001, one-way ANOVA, Tukey’s m.c.t.

