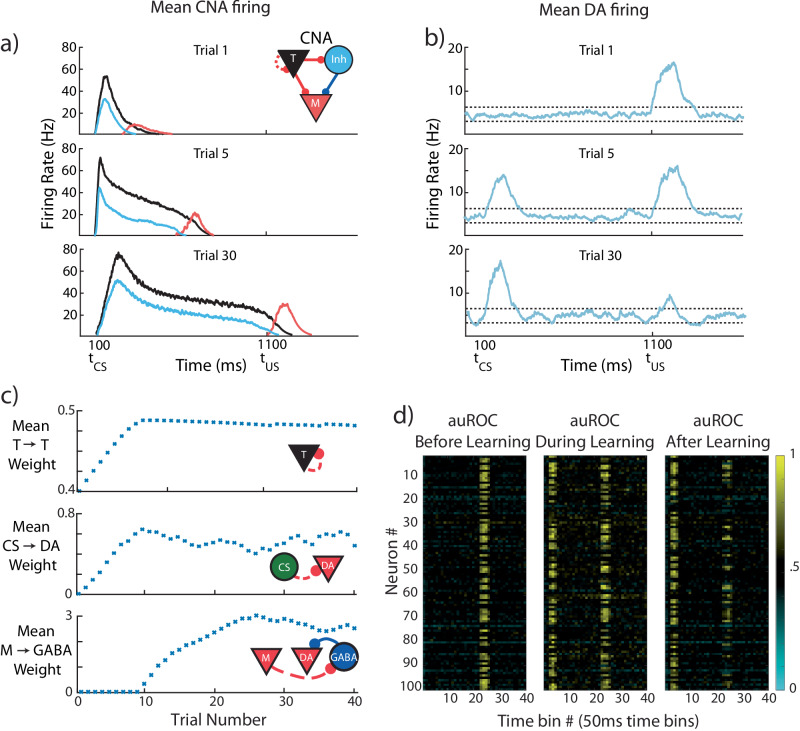
Fig. 6. CS-evoked and US-evoked model dopamine responses evolve on different timescales.
The model is trained for 30 trials while being presented with a conditioned stimulus (CS) at 100 ms and a reward at 1100 ms. a Mean firing rates for the core neural architecture (CNA) (see inset for colors; T = Timers, M = Messengers, Inh = Inhibitory), for three different stages of learning. b Mean firing rate over all DA neurons taken at the same three stages of learning. Firing above or below thresholds (dotted lines) evokes positive or negative D(t) in PFC. c Evolution of mean synaptic weights over the course of learning. Top, middle, and bottom, mean strength of Timer→Timer, CS → DA (conditioned stimulus → dopamine), and Messenger→GABA synapses, respectively. d Area under receiver operating characteristic (auROC, see Methods) for all VTA neurons in our model for 15 trials before (left, unconditioned stimulus, US, only), 15 trials during (middle, CS + US, conditioned + unconditioned stimulus), and 15 trials after (right, CS + US) learning. Values above and below 0.5 indicate firing rates above and below the baseline distribution. Definitions: dopamine (DA), prefrontal cortex (PFC), inhibitory neurons (GABA).

