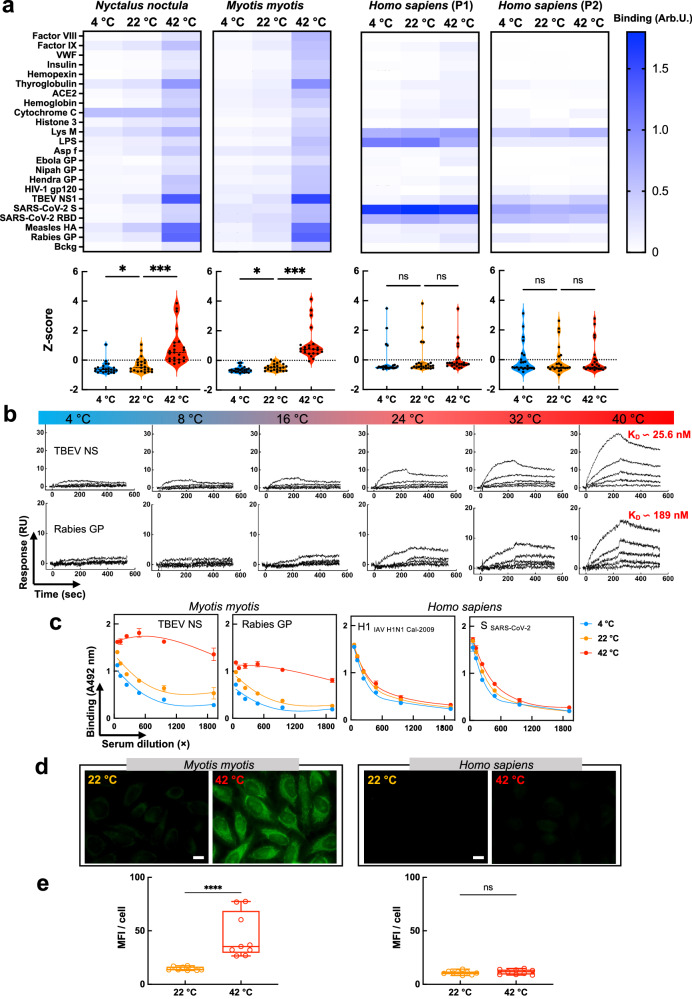
Fig. 1. Temperature modulates antigen binding properties of bat IgG.
a Heat map depicting binding intensity of IgG purified from pooled sera of N. noctula, M. myotis, and healthy human (two different pools) to a panel of antigens. The IgG were purified from sera pools with 4–5 individuals. Reactivity of bat and human IgG was evaluated at 4 °C, 22 °C and 42 °C by ELISA. Binding of IgG to the blocking agent (Bckg) is also shown. Binding intensity against each target represents average optical density (n = 2 for M. Myotis and human; and n = 2 and n = 1 for N. noctula) after subtraction of the background binding (measured after incubation of the detection reagents with the respective antigens in the absence of antibodies). Violin plots corresponding to each heat map show the Z-score values (n = 23). The Z-score for each target antigen and backround is presented as an individual circle. P values were determined using one-way analysis of variance (ANOVA) with Friedman multiple comparison test, *p < 0.0153, ***p < 0.0007, n.s., not significant. b Real-time interaction profiles showing binding of M. myotis IgG to Rabies virus glycoprotein and TBEV NS1 immobilized on a sensor chip as a function of temperature. Antibodies were injected at serial dilutions at a concentration range 670–41.875 nM. c Effect of temperature on antigen binding by bat and human IgG in whole sera. Pooled bat and human sera were serially diluted from 60 × to 1920 × and incubated with immobilized antigens at 4 °C, 22 °C and 42 °C. Each data point represents average IgG binding intensity ± SD from n = 3 technical replicates. d Immunofluorescence analyses of bat and human IgG binding to HEp-2 cells at 22 °C and 42 °C. The images are representative examples from n = 9 fluorescence acquisitions from two independent experiments (magnification × 63). The white bar corresponds to 10 μm. e Quantification of fluorescence intensity from immunofluorescence analyses of binding of bat and human IgG to Hep-2 cells. The graphs show the mean fluorescence intensity of n = 9 images, for each condition, acquired in two independent experiments. Whiskers of the box plots depict minimal and maximal values of MFI, the line represent the median value, the bonds of box correspond to interquartile range. Statistical analyses were performed by a nonparametric t-test, Mann-Whitney two-tailed test, ****p < 0.0001. Source data are provided as a Source Data file.

