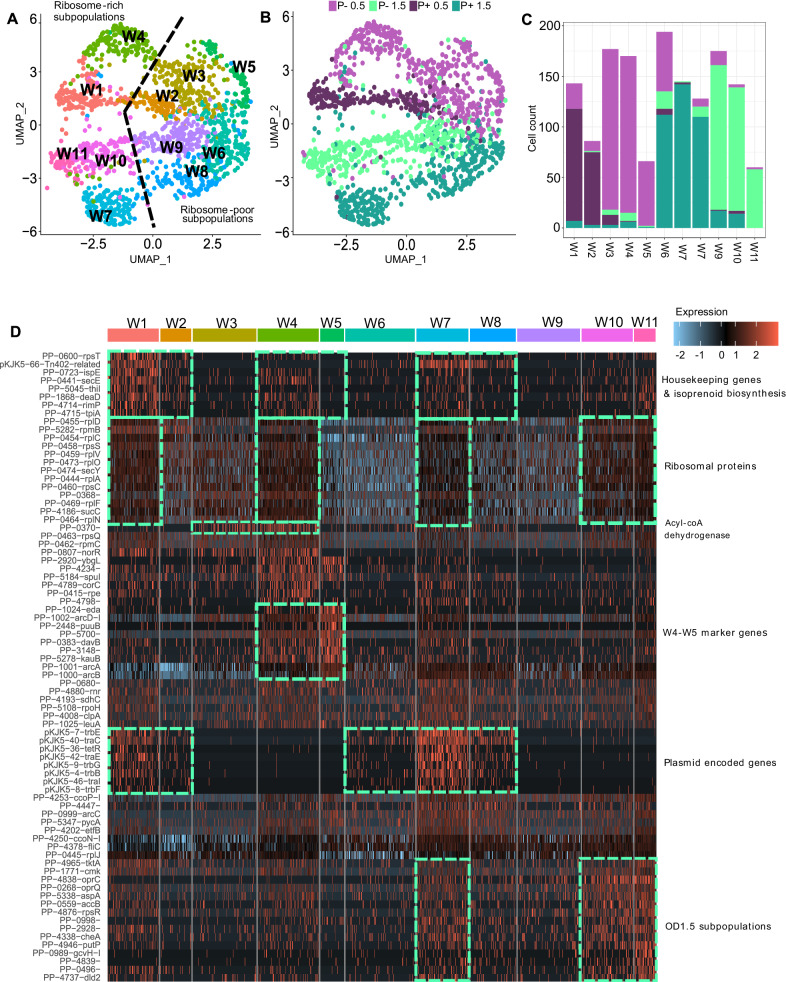
Fig. 2. Whole single-cell transcriptomes generally cluster in accordance with growth state and the presence/absence of the plasmid.
Subpopulation clustering identified by single-cell transcriptomics of P. putida carrying a plasmid (P +) or not (P−) at early (OD0.5) and late exponential growth (OD1.5) (n = 1 independent experiment; 1486 cells). A UMAP obtained by microSPLiT scRNA sequencing identified 11 whole transcriptome clusters (W1-W11). Clustering was performed with an integrative approach combining Euclidean distance-based K-nearest neighbor, refining the edge weights with the Jaccard similarity and the Louvain algorithm. Color of the dot indicate to which cluster the cell belongs as indicated on the graph (W1-11). B Same UMAP graph where color of the dot indicate the growth state (OD0.5 and OD1.5) and the presence of the plasmid (P +/P−). C Cell transcriptomes from OD0.5 were mainly distributed in clusters W1-5, while cells from OD1.5 were mainly distributed in clusters W6-W11. Data are presented as absolute cell count. D Heatmap of normalized and centered-scaled transcript number per cell as displayed through the expression color code (normalization consist in a log10 transformation of transcript numbers * 10,000 divided by summed transcript number of the cell). Top colors represent the cell cluster (W1-11). The top 8 biomarker genes (p < 0.05) identified by a two-sided Wilcoxon signed-rank test are shown for each cluster (common biomarker to multiple groups where displayed only once). The p-value associated with each marker gene for each cluster (cluster of interest vs. all cells) can be found in Supplementary Dataset 1. Source data are provided as a Source Data file.

