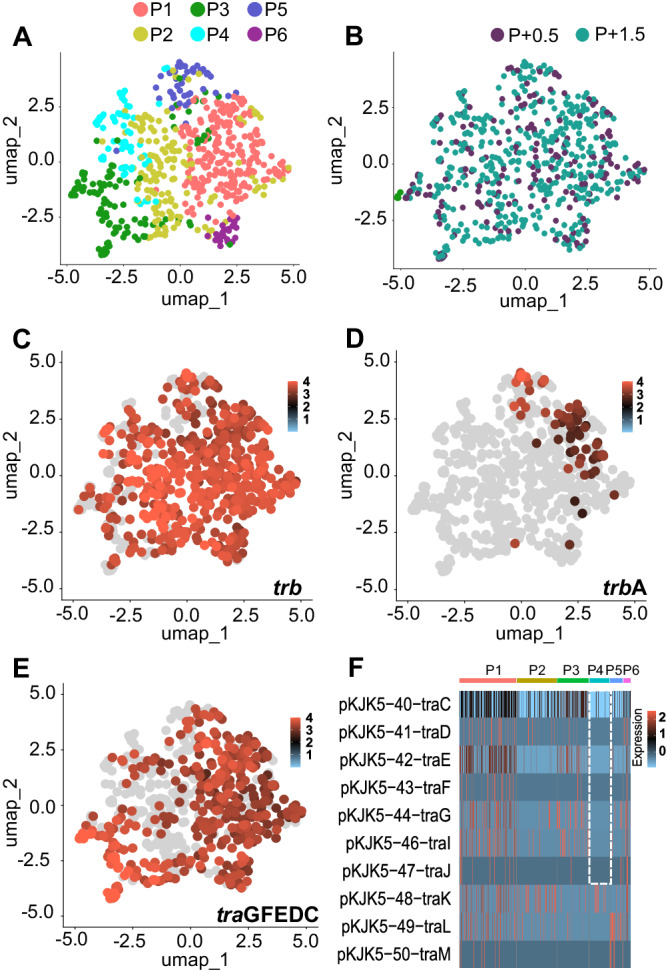
Fig. 5. Plasmid single-cell transcriptome clustering suggests population heterogeneity in plasmid gene transcription, with differential expression of tra genes.

Subpopulation clustering identified by single-cell transcriptomics of P. putida plasmid carriers at early (OD0.5) and late exponential growth (OD1.5) (n = 621 P+ cells, Table S3). A UMAP obtained by microSPLiT scRNA sequencing identified 6 plasmid transcriptome clusters (P1-P6) when only plasmid transcripts were analyzed with 6 dimensions (see Fig. S12). Clustering was performed with an integrative approach combining Euclidean distance-based K-nearest neighbor, refining the edge weights with the Jaccard similarity and the Louvain algorithm. Same UMAP, where dots were colored according to (B) the OD of the cell or (C–E) to normalized transcript number of (C) all trb genes, (D) trbA genes, (E) traGFEDC genes. Normalization consist in a log10 transformation of transcript numbers+1 * 10,000 divided by summed plasmid transcript number of the cell. F Heatmap of the normalized centered-scaled number of tra transcripts per cell ordered according to clusters P1-6. Source data are provided as a Source Data file.
