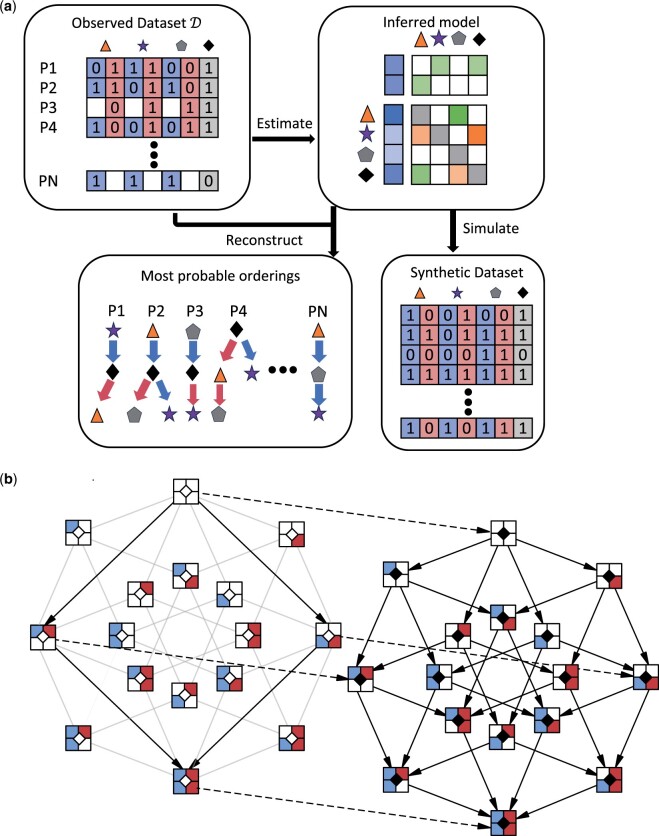
Figure 1.
(a) Workflow of metMHN. In the top-left section, we show the types of input data that metMHN processes. Each row corresponds to a patient, each column to an event in the primary tumor (blue) or the metastasis (red). Events are represented by symbols and their status is encoded with a ‘1’ for present, ‘0’ for absent, or left blank if a tumor is unobserved. On the right, we present the primary output of metMHN: A network of interactions between events in matrix form. In the lower section, we show the most probable chronological ordering in which events accumulated in observed data points as inferred by metMHN. The progression trajectory of the primary tumor is indicated by blue arrows, while the trajectory of the metastasis is marked by red arrows. (b) The metMHN process and its state space: Black-bordered squares represent full states: the two compartments on the left detail the status of the primary tumor, the two on the right correspond to the metastasis, and the central diamond symbolizes the seeding event. The diagram is divided into two subspaces, with the left half constituting the subspace and the right half comprising the subspace . Transitions between states that occur at non-zero rates are shown as solid black arrows. Transitions that are not possible in but are possible in are indicated by greyed-out arrows. Dotted arrows highlight transitions that influence the seeding event specifically.

