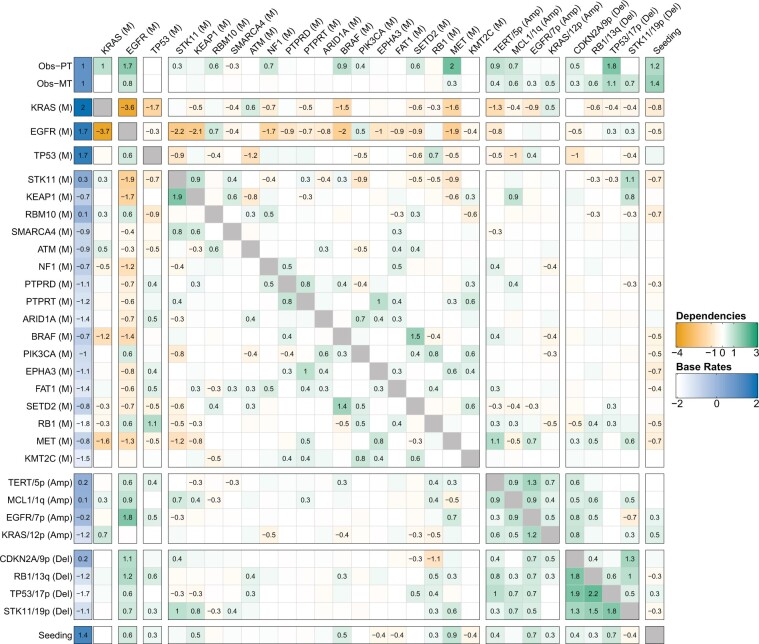
Figure 2.
Interactions between progression events in lung adenocarcinomas. The log-effects on observation (clinical detection) of the primary tumor and metastasis and are plotted in the first two rows, the remaining matrix shows the log-interaction strengths among genomic events θ. Promoting effects are colored in green and suppressive effects are colored in orange. The base rates of all events are plotted on the left (in blue). The effects an event i exerts on other events j are collected in the ith column (outgoing edges). Vice versa, the effects that events j exert on event i are collected in the ith row (incoming edges). Effects of genomic events on seeding are shown in the bottom row. Vice versa, effects from seeding on genomic events are shown in the rightmost column.

