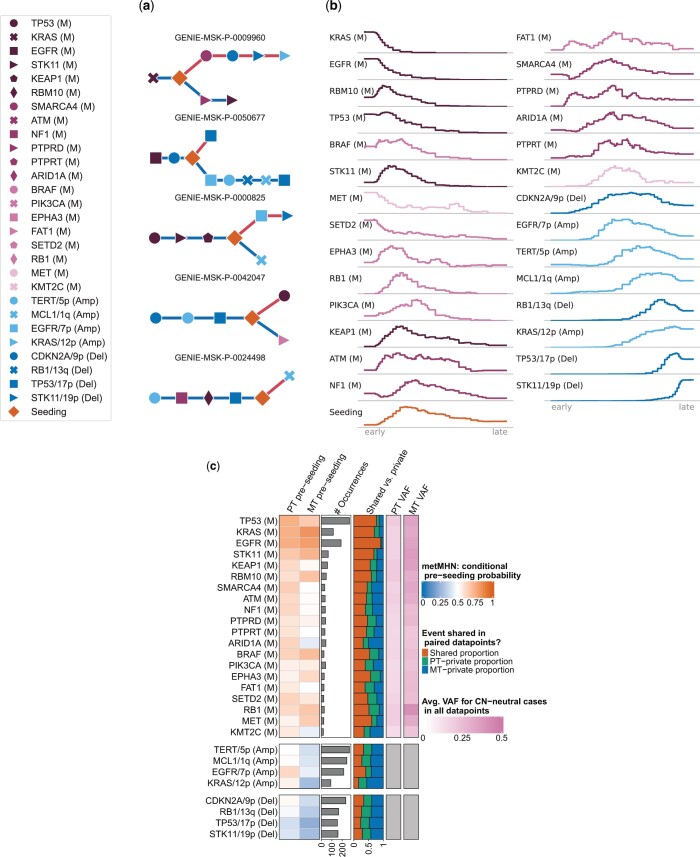
Figure 3.
(a) Event orders for five patients as inferred by metMHN. Events accumulate from left to right. Blue edges represent the primary tumor development, red edges the one of the metastasis. Distances between events do not correspond to real or estimated time. (b) Distribution of relative positions in trajectories of metastasis genotypes. The left end of the axes corresponds to the beginning, and the right to the end of progression. (c) Empirical evidence from paired samples and pre-seeding probabilities estimated by metMHN through simulation. The first and second column show the pre-seeding probabilities estimated by metMHN conditioned on the event being observed in the primary tumor (column 1) or the metastasis (column 2). Column 3 shows the number of occurrences for each event in the paired data, column 4 shows the proportions of shared versus private occurrences for each event in the paired data. Columns 5 and 6 show the mean variant allele frequencies in the primary tumor and the metastasis, respectively.

