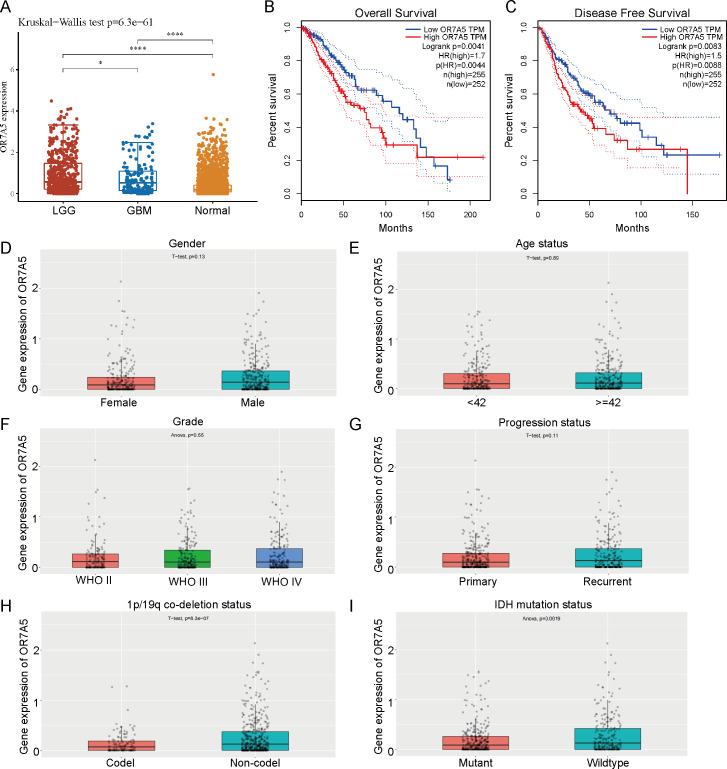
Figure 10. Expression levels of OR7A5 in glioma and its correlation with prognosis and clinical-pathological features.
(A) Analysis of OR7A5 expression levels in LGG (G1), GBM (G2), and normal tissues through the TCGA and GTEx databases.(B) Kaplan–Meier curves of OS for subgroups with high and low OR7A5 expression. (C) Kaplan–Meier curves of DFS for subgroups with high and low OR7A5 expression. Association between OR7A5 expression levels and clinical-pathological features of patients with glioma: (D) Sex, (E) Age status, (F) Grade, (G) Progression status, (H) 1p/19q co-deletion status, (I) IDH mutation status.

