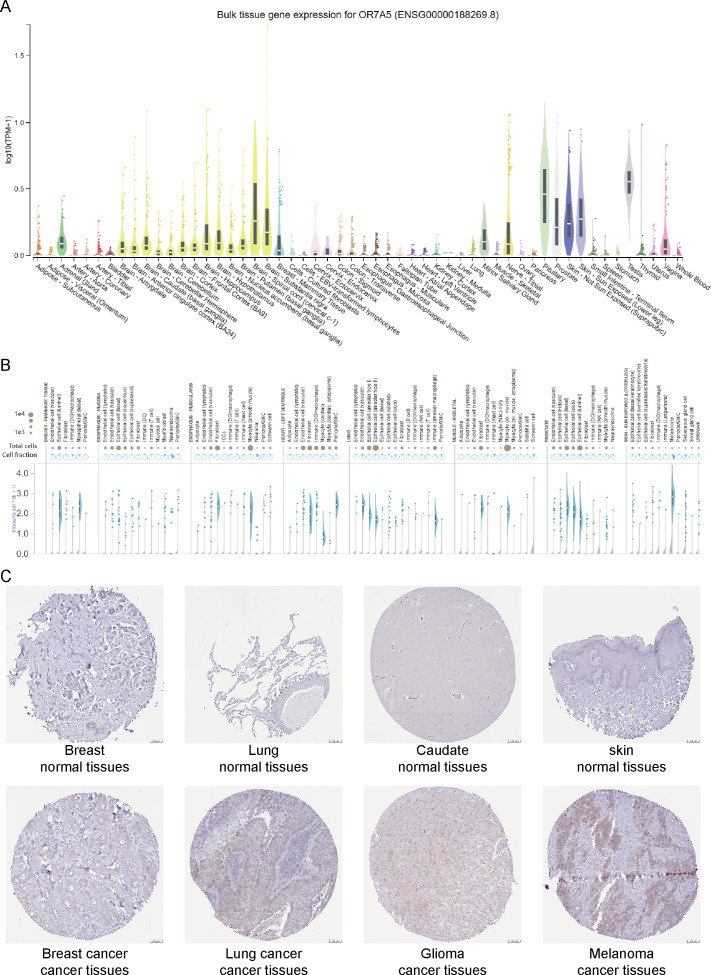
Figure 2. Expression levels of OR7A5 in normal and cancer tissues.
(A) Analysis of OR7A5 expression in normal tissues through the GTEx database. (B) Expression levels of OR7A5 in single-cell analysis within individual tissues from the GTEx database. (C) IHC images of OR7A5 observed in normal tissues (breast, lung, caudate, and skin) and tumor tissues (breast cancer, lung cancer, glioma, and melanoma) from the HPA database.

