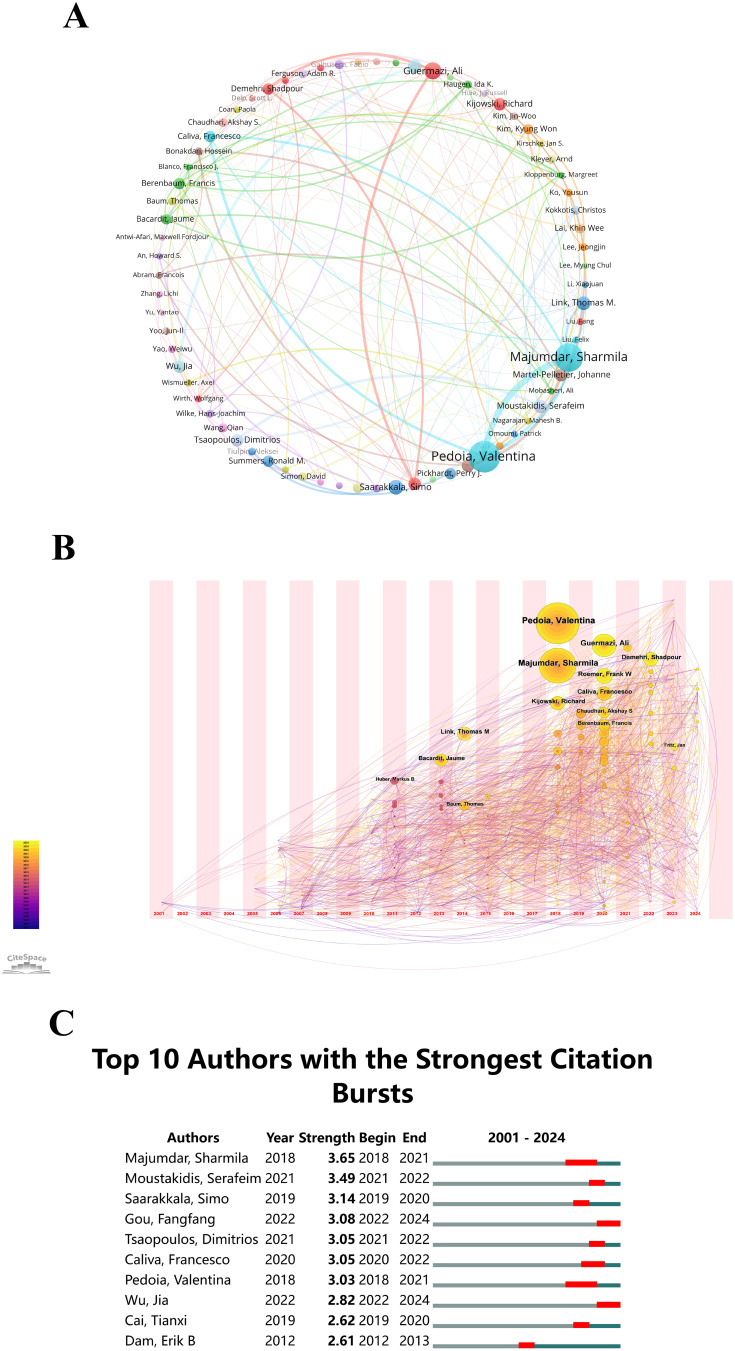
Figure 4.
(A) Author co-occurrence map. Circles and text labels constitute a node, with different colors representing distinct clusters. (B) Temporal overlay of the author’s collaborative network. Each sphere symbolizes an author, and the combined size of overlapping spheres, representing the sum of their sizes along the yearly ring line, corresponds to the total number of authored articles. Purple-red indicates earlier publications by the author, yellow signifies recent publications, and overlapping colors denote multi-year publishing. Overlapping colors on the spheres create a ring-like pattern. Connections between nodes in temporal zones depict collaborative occurrences among authors. (C) Top 10 authors with the most significant citation bursts in publications related to “artificial intelligence-musculoskeletal diseases”.

