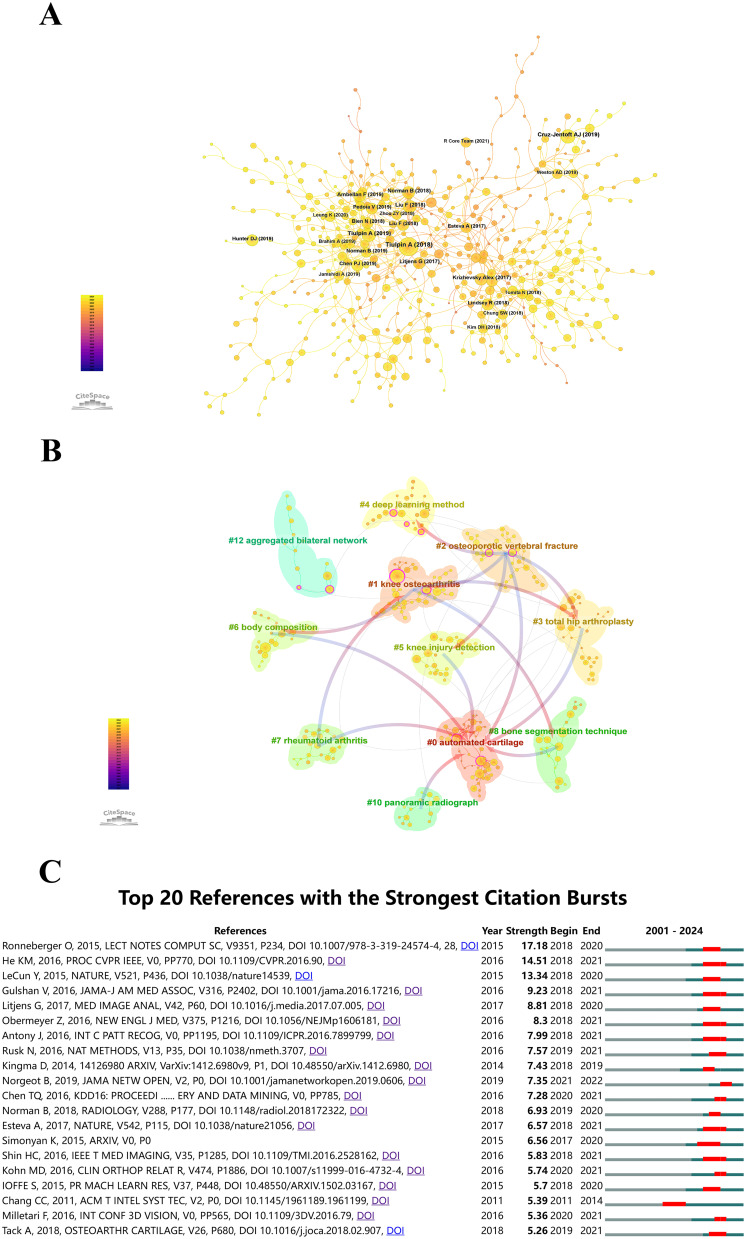
Figure 6.
(A) Co-citation analysis chart for “artificial intelligence-musculoskeletal diseases”. The sizes of the overlaid circles, corresponding to the sizes of the circles on the annual rings, are proportional to the number of citations. Purple indicates earlier citation times, yellow indicates later citation times, and overlapping colors indicate citations in corresponding years. The lines connecting the circles represent the co-citation situation of the literature, and the nodes marked in magenta are critical nodes with a centrality greater than 0.1. (B) Co-cited literature network map. The sizes of the overlaid circles, corresponding to the sizes of the circles on the annual rings, are proportional to the number of citations. Purple indicates earlier citation times, yellow indicates later citation times, and overlapping colors indicate citations in corresponding years. The lines connecting the circles represent the co-citation situation of the literature, and the nodes marked in magenta are critical nodes with a centrality greater than 0.1. (C) Top 20 references with the highest citation bursts.

