Figure 5.

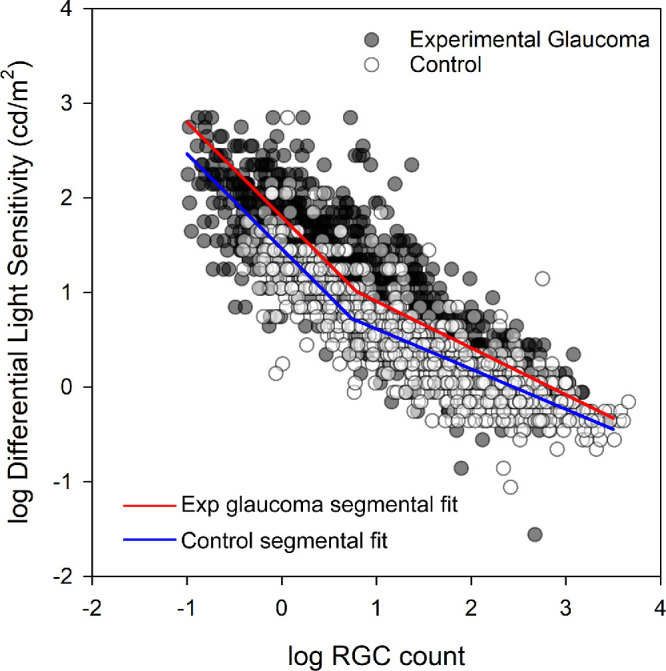
The relationship between logRGC counts and logDLS in control (open symbols) and experimental glaucoma (closed symbols) samples. The red and blue lines illustrate the segmental fits for the experimental glaucoma and control samples.

The relationship between logRGC counts and logDLS in control (open symbols) and experimental glaucoma (closed symbols) samples. The red and blue lines illustrate the segmental fits for the experimental glaucoma and control samples.