
Figure 4. Surface biomarker expression of CD11c-DTR murine splenocytes after repeated DT injections.
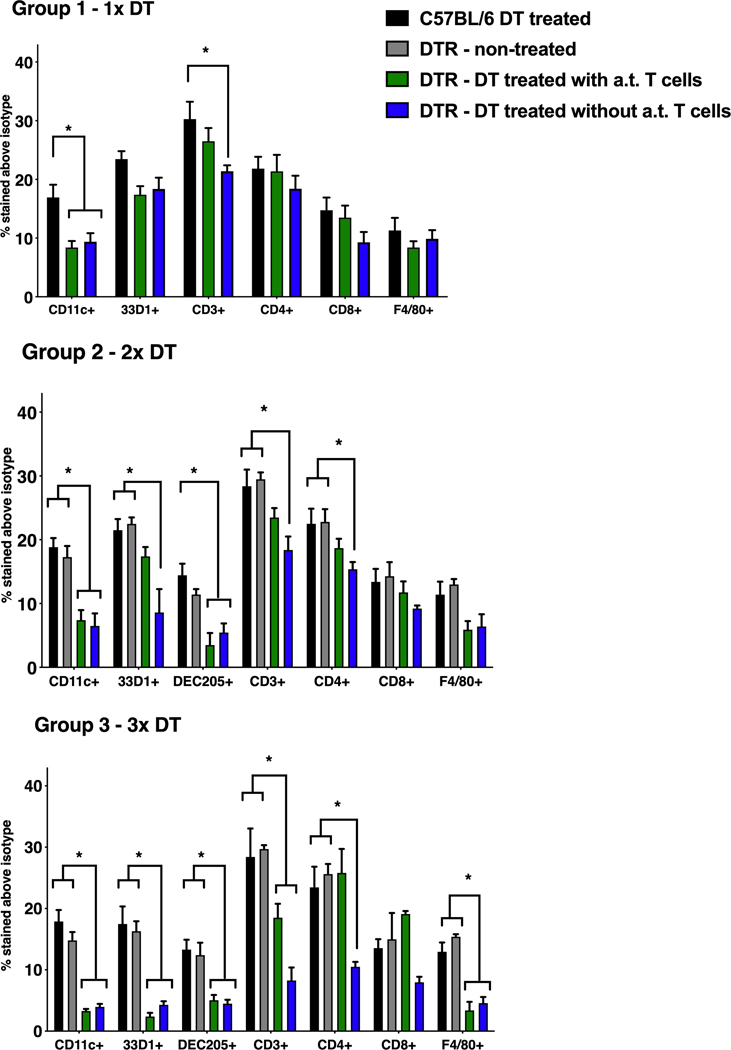
CD11c-DTR mice, with or without adoptively transferred (a.t.) OT-II T cells, were given either 1, 2 or 3 DT injections at 4ng/g body weight, spaced 2 days apart as per the timeline shown in Figure 1. (A) Group 1 received 1x DT injection, (B) group 2 – 2x DT injections and (C) group 3 – 3x DT injections. Statistical analysis was done using ANOVA followed by Sidak’s post-test and differences within 95% confidence intervals were accepted as significant (* = p < 0.05). Error bars represent standard error of mean values of 4 – 6 mice per group.