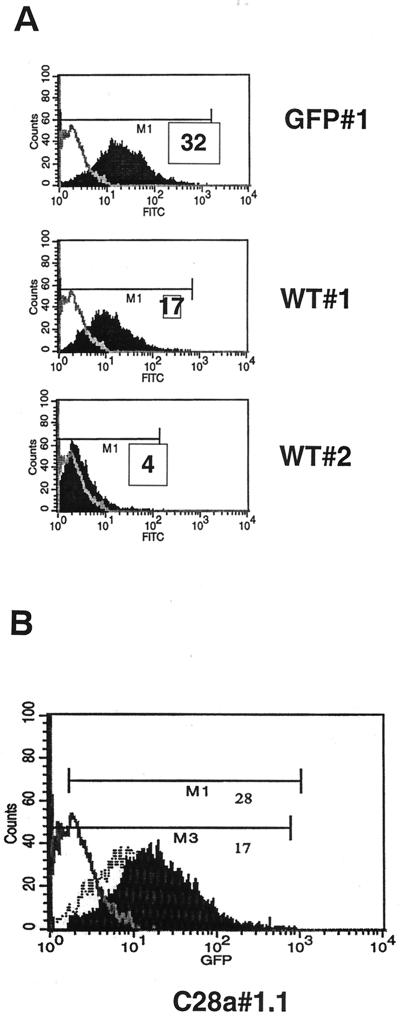
FIG. 1.
FACS analysis of clonal cell lines expressing HN-GFP. (A) FACS analysis of WT#1 and WT#2 cell lines. The x and y axes of the histograms represent green fluorescence (fluorescein isothiocyanate) and cell counts, respectively. Fluorescence in the negative control 293T cells is overlaid as a gray line. The relative MFI (M1) for each cell line are indicated. WT#1 cell line displays approximately fivefold more fluorescence than WT#2. (B) FACS analysis of the mutant HN C28a#1.1-expressing cell line. The fluorescence of the negative control 293T and WT#1 cell lines are overlaid as a gray line and a hatched line, respectively. M1 and M3 indicate the mean fluorescent units of C28a#1.1 and WT#1 cells, respectively.

