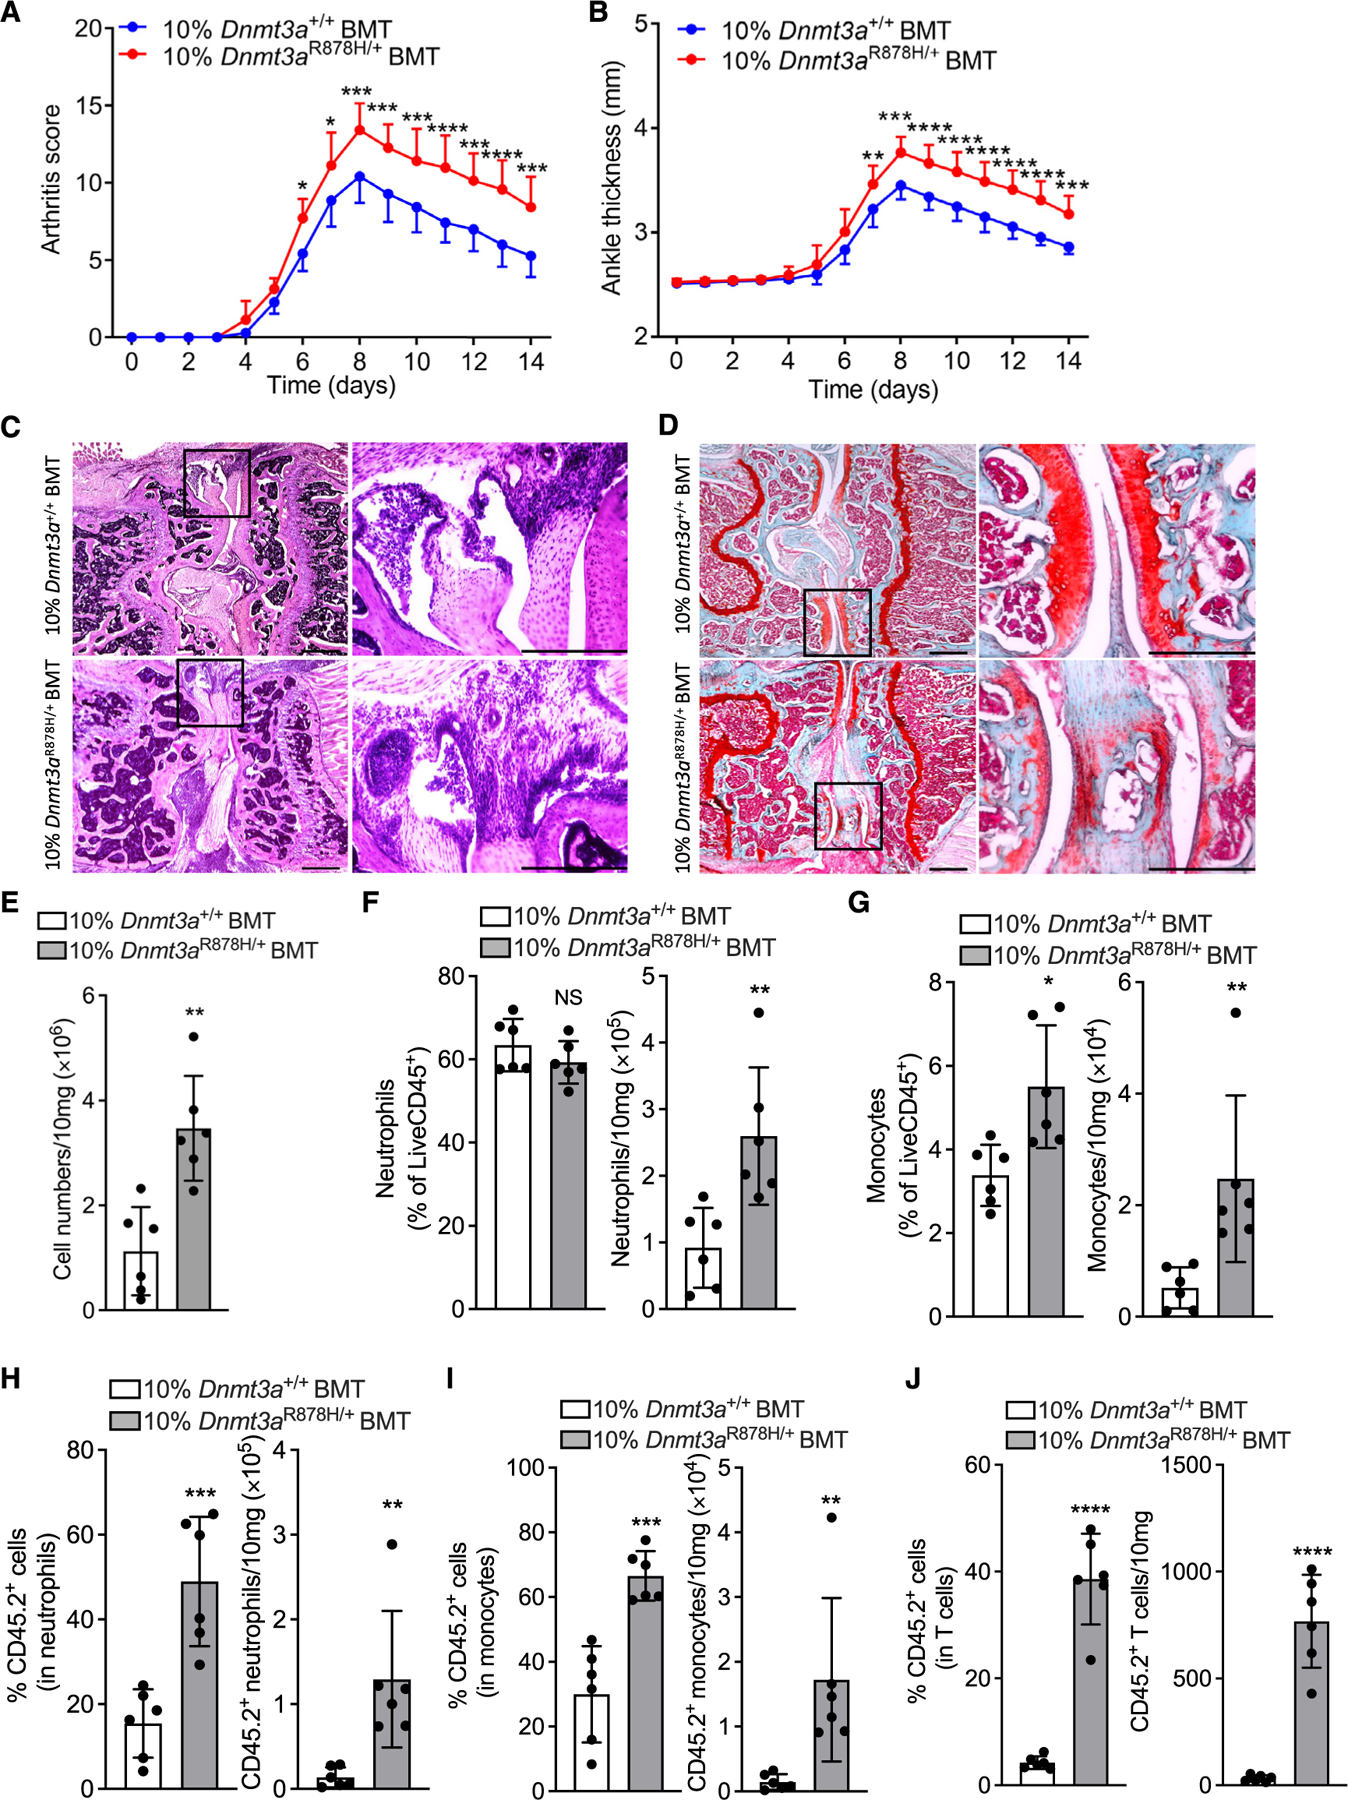
Figure 3. Clonal expansion of Dnmt3aR878H/+ cells increases the severity of inflammatory arthritis.

BMT was performed as in Figure 1A, and after 12 weeks, recipient mice were subjected to CAIA.
(A and B) (A) Clinical arthritis scores and (B) joint thickness at indicated time points.
(C and D) (C) Representative images of H&E and (D) of safranin-O staining of tissue sections from knee joints harvested on day 7. Scale bars, 500 μm.
(E–G) (E) Total cell numbers and (F) percentage (left) and numbers (right) of neutrophils (CD45+CD11b+Ly6G+) and (G) of monocytes (CD45+CD11b+Ly6C+Ly6G−) in the synovium of knee joints on day 7.
(H–J) (H) Percentage (left) and total counts (right) of CD45.2+ neutrophils (CD11b+Ly6G+), (I) CD45.2+ monocytes (CD11b+Ly6C+Ly6G−), and (J) CD45.2+ T cells (CD3+) in the synovium.
Data are means ± SD (n = 6–7 mice/group). *p < 0.05; **p < 0.01; ***p < 0.001; ****p < 0.0001; NS, not significant. Two-way ANOVA with repeated measures and Sidak’s post-test for comparison with 10%Dnmt3a+/+ BMT mice (A and B); Student’s unpaired t test (E, F, J, and G–I left); Mann-Whitney U test (G–I right).
