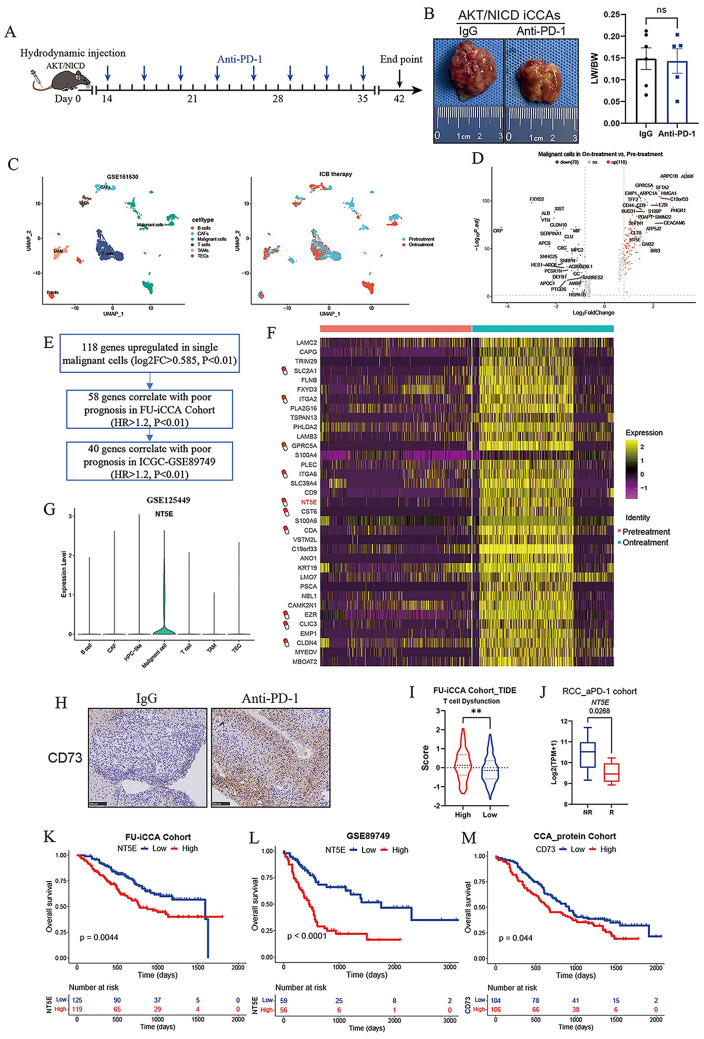
Fig. 1.
Elevated CD73 expression of malignant cells in response to ICBs immunotherapy. (A) Schematic representation of the treatment schedule for anti-PD-1 monotherapy in AKT/NICD-induced spontaneous murine iCCAs. (B) Representative gross images and statistical results from AKT/NICD-induced murine iCCAs that received indicated treatments (6 mice for IgG and 5mice for anti-PD-1 treatment, 10 mg/kg). (C) scRNA-seq analysis of GSE151530 showing 12 iCCA biopsies from 10 patients collected at baseline or during ICBs therapy (PD-1 or PD-L1/CTLA-4). UMAP plot showing single cells distinguished by cell types and cell origins from different biopsy time points. (D) Volcano plot showing differentially expressed genes in malignant cells before and after ICBs treatment. (E) 40 genes that were upregulated in single malignant cells following ICBs therapy were associated with poor prognosis in both FU-iCCA Cohort and ICGC Cohort. (F) The drug-gene interaction database (DGIdb) database was used to identify the potential drug targets among the indicated genes. (G) Violin plot showing the expression levels of CD73 in different cell types in iCCA from GSE125449. (H) Immunohistochemical staining images showing CD73 expression in AKT/NICD iCCAs that received IgG or anti-PD-1 treatment. (I) Analysis of T cell dysfunction signature scores by TIDE algorithm in patients with high or low CD73 expression in FU-iCCA cohort. (J) Expression levels of CD73 between Non-Responsive versus Responsive (NR vs. R) samples to anti-PD-1 monotherapy in RCC cohort. Kaplan-Meier survival curves of OS for patients grouped by CD73 mRNA expression level in FU-iCCA cohort (K) and ICGC cohort (L), as well as CD73 protein levels in CCA protein cohort (M). **P < 0.01; OS, overall survival; iCCA, intrahepatic cholangiocarcinoma

