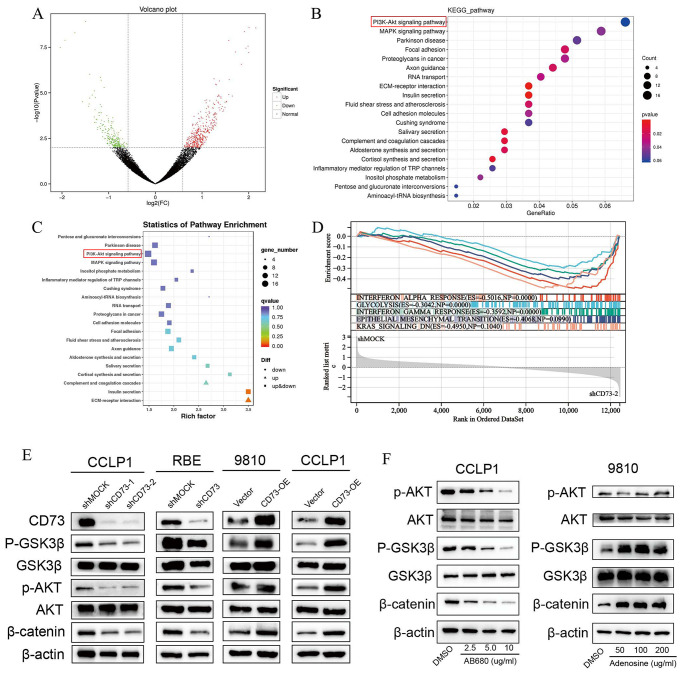
Fig. 4.
CD73 activates the AKT/GSK3β/β-catenin signaling pathway in iCCA cells via adenosine (A) Volcano plot showing differentially expressed genes in RBE cells transfected with shCD73 and shMOCK identified by RNA-seq analysis. (B-C) KEGG pathway analysis showing differential signaling pathways regulated by CD73 knockdown in RBE cells. (D) Gene set enrichment analysis (GSEA) showing that Hallmark gene sets Hypoxia, Inflammatory response, Glycolysis, Epithelial-mesenchymal transition pathways were enriched in shMOCK RBE cells compared with shCD73 cells. (E) Phosphorylation levels of AKT, GSK3β, and total β-catenin protein expression in the indicated iCCA cells as determined by WB assays. (F) Phosphorylation levels of AKT, GSK3β, and total β-catenin protein levels in CCLP1 cells treated with different concentrations of CD73 enzymatic activity inhibitor AB680 (left) or in 9810 cells under different concentrations of adenosine treatments (right) detected by WB assays

