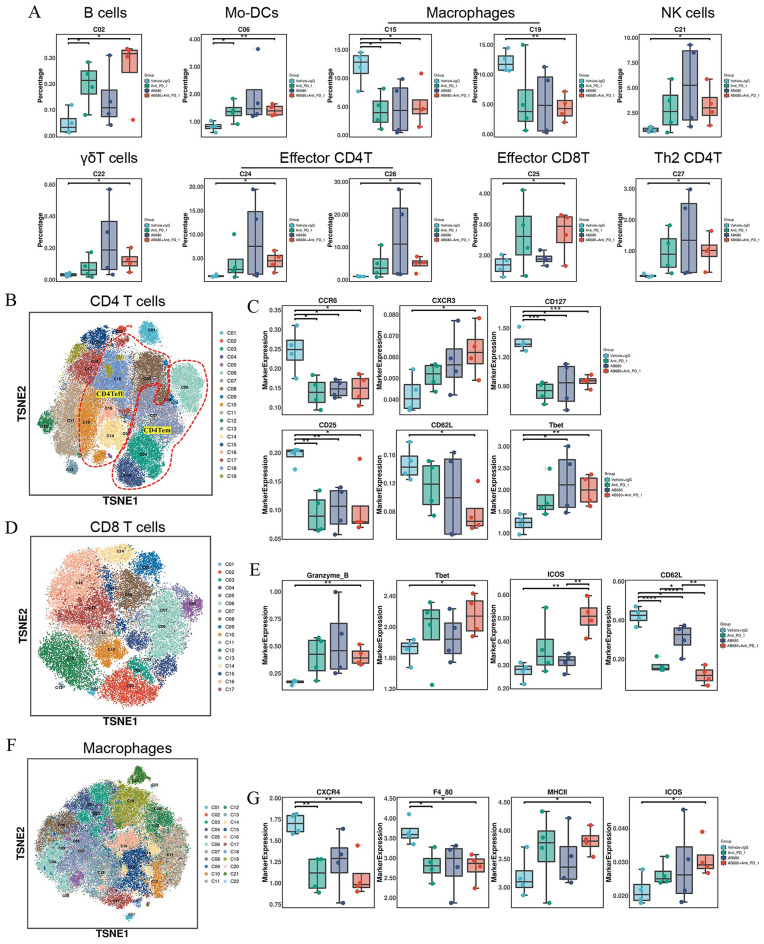
Fig. 7.
In-depth characterization of the immune-cell compartment by CyTOF analysis (A) Proportions of differential immune-cell subsets identified by CyTOF between the combination treatment group and control group. (B) Re-clustering analysis of CD4+ T cells according to the expression of selected 42 panel markers. (C) The expression level of indicated markers in tumor-infiltrating CD4+ T cells among the four groups. (D) Re-clustering analysis of CD8+ T cells and (E) expression level of indicated markers in tumor-infiltrating CD8+ T cells among the four groups. (F) Re-clustering analysis of macrophages and (G) expression level of indicated markers in tumor-infiltrating macrophages among the four treatment groups. *P < 0.05, **P < 0.01, ***P < 0.001, ****P < 0.0001

