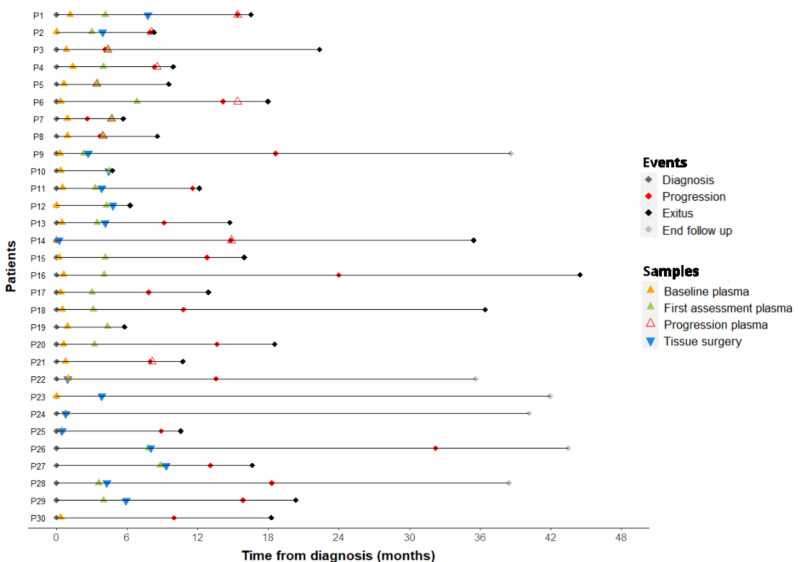
Figure 1.
Clinical events and sample collection during follow-up. Horizontal lines represent the time frame from diagnosis to the end of the follow-up for each patient. Colored diamonds represent clinical events including diagnosis (grey), progression (red), exitus (black) and end of follow-up (grey). Colored triangles represent samples collected from each patient, tissue-surgery (blue) and plasma samples at different time points including, baseline plasma (orange), first tumor assessment plasma (green) and progression plasma (red).

