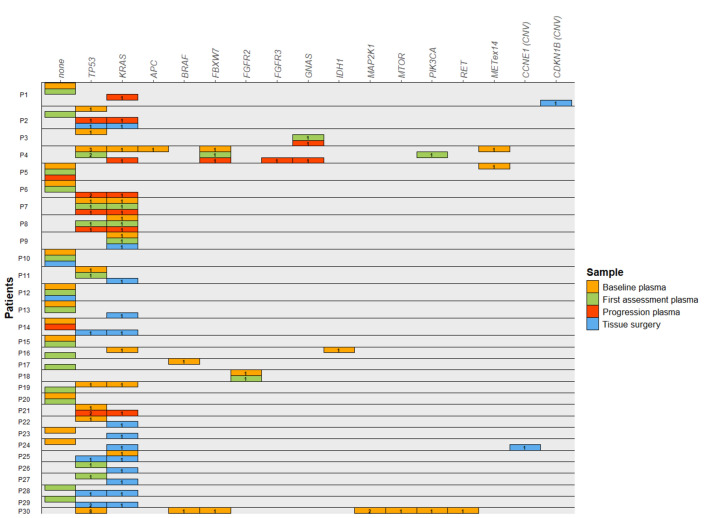
Figure 2.
Summary of the pathogenic genomic alterations found in plasma and tissue samples from all patients. Horizontal boxes represent one patient, with one sub-line for each of the samples available for each patient. Colored rectangles represent the gene in which a genetic alteration was identified in each sample, including baseline plasma (orange), first tumor assessment plasma (green), progression plasma (red) and tissue surgery (blue). The label in each rectangle depicts the number of alterations observed for each gene.

