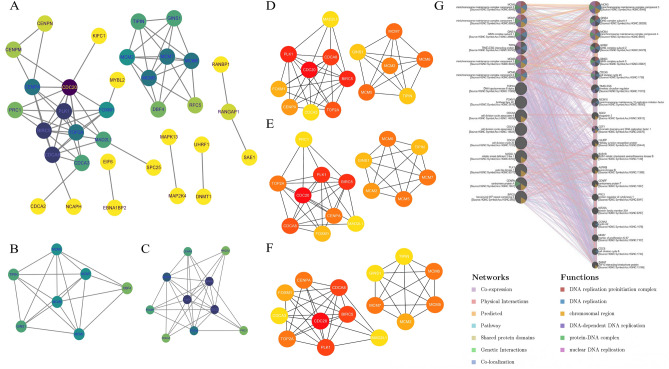
Figure 6.
Identifcation and analysis of hub genes. (A) Protein–protein interaction network from String10.0. The purpler the node represents its higher significance, the yellower it is the opposite. (B) Cluster 1 from MCODE analysis of key genes. (C) Cluster 2 from MCODE analysis of key genes. (D) Identifcation of hub genes by CytoHubba of MCC ranking method. (E) Identifcation of hub genes by CytoHubba of MNC ranking method. (F) Identifcation of hub genes by CytoHubba of Dgree ranking method. (G) Hub genes and their co-expression genes were analyzed by GeneMANIA.

