
Fig. 1. PZM burden is correlated with biological and technical variables.
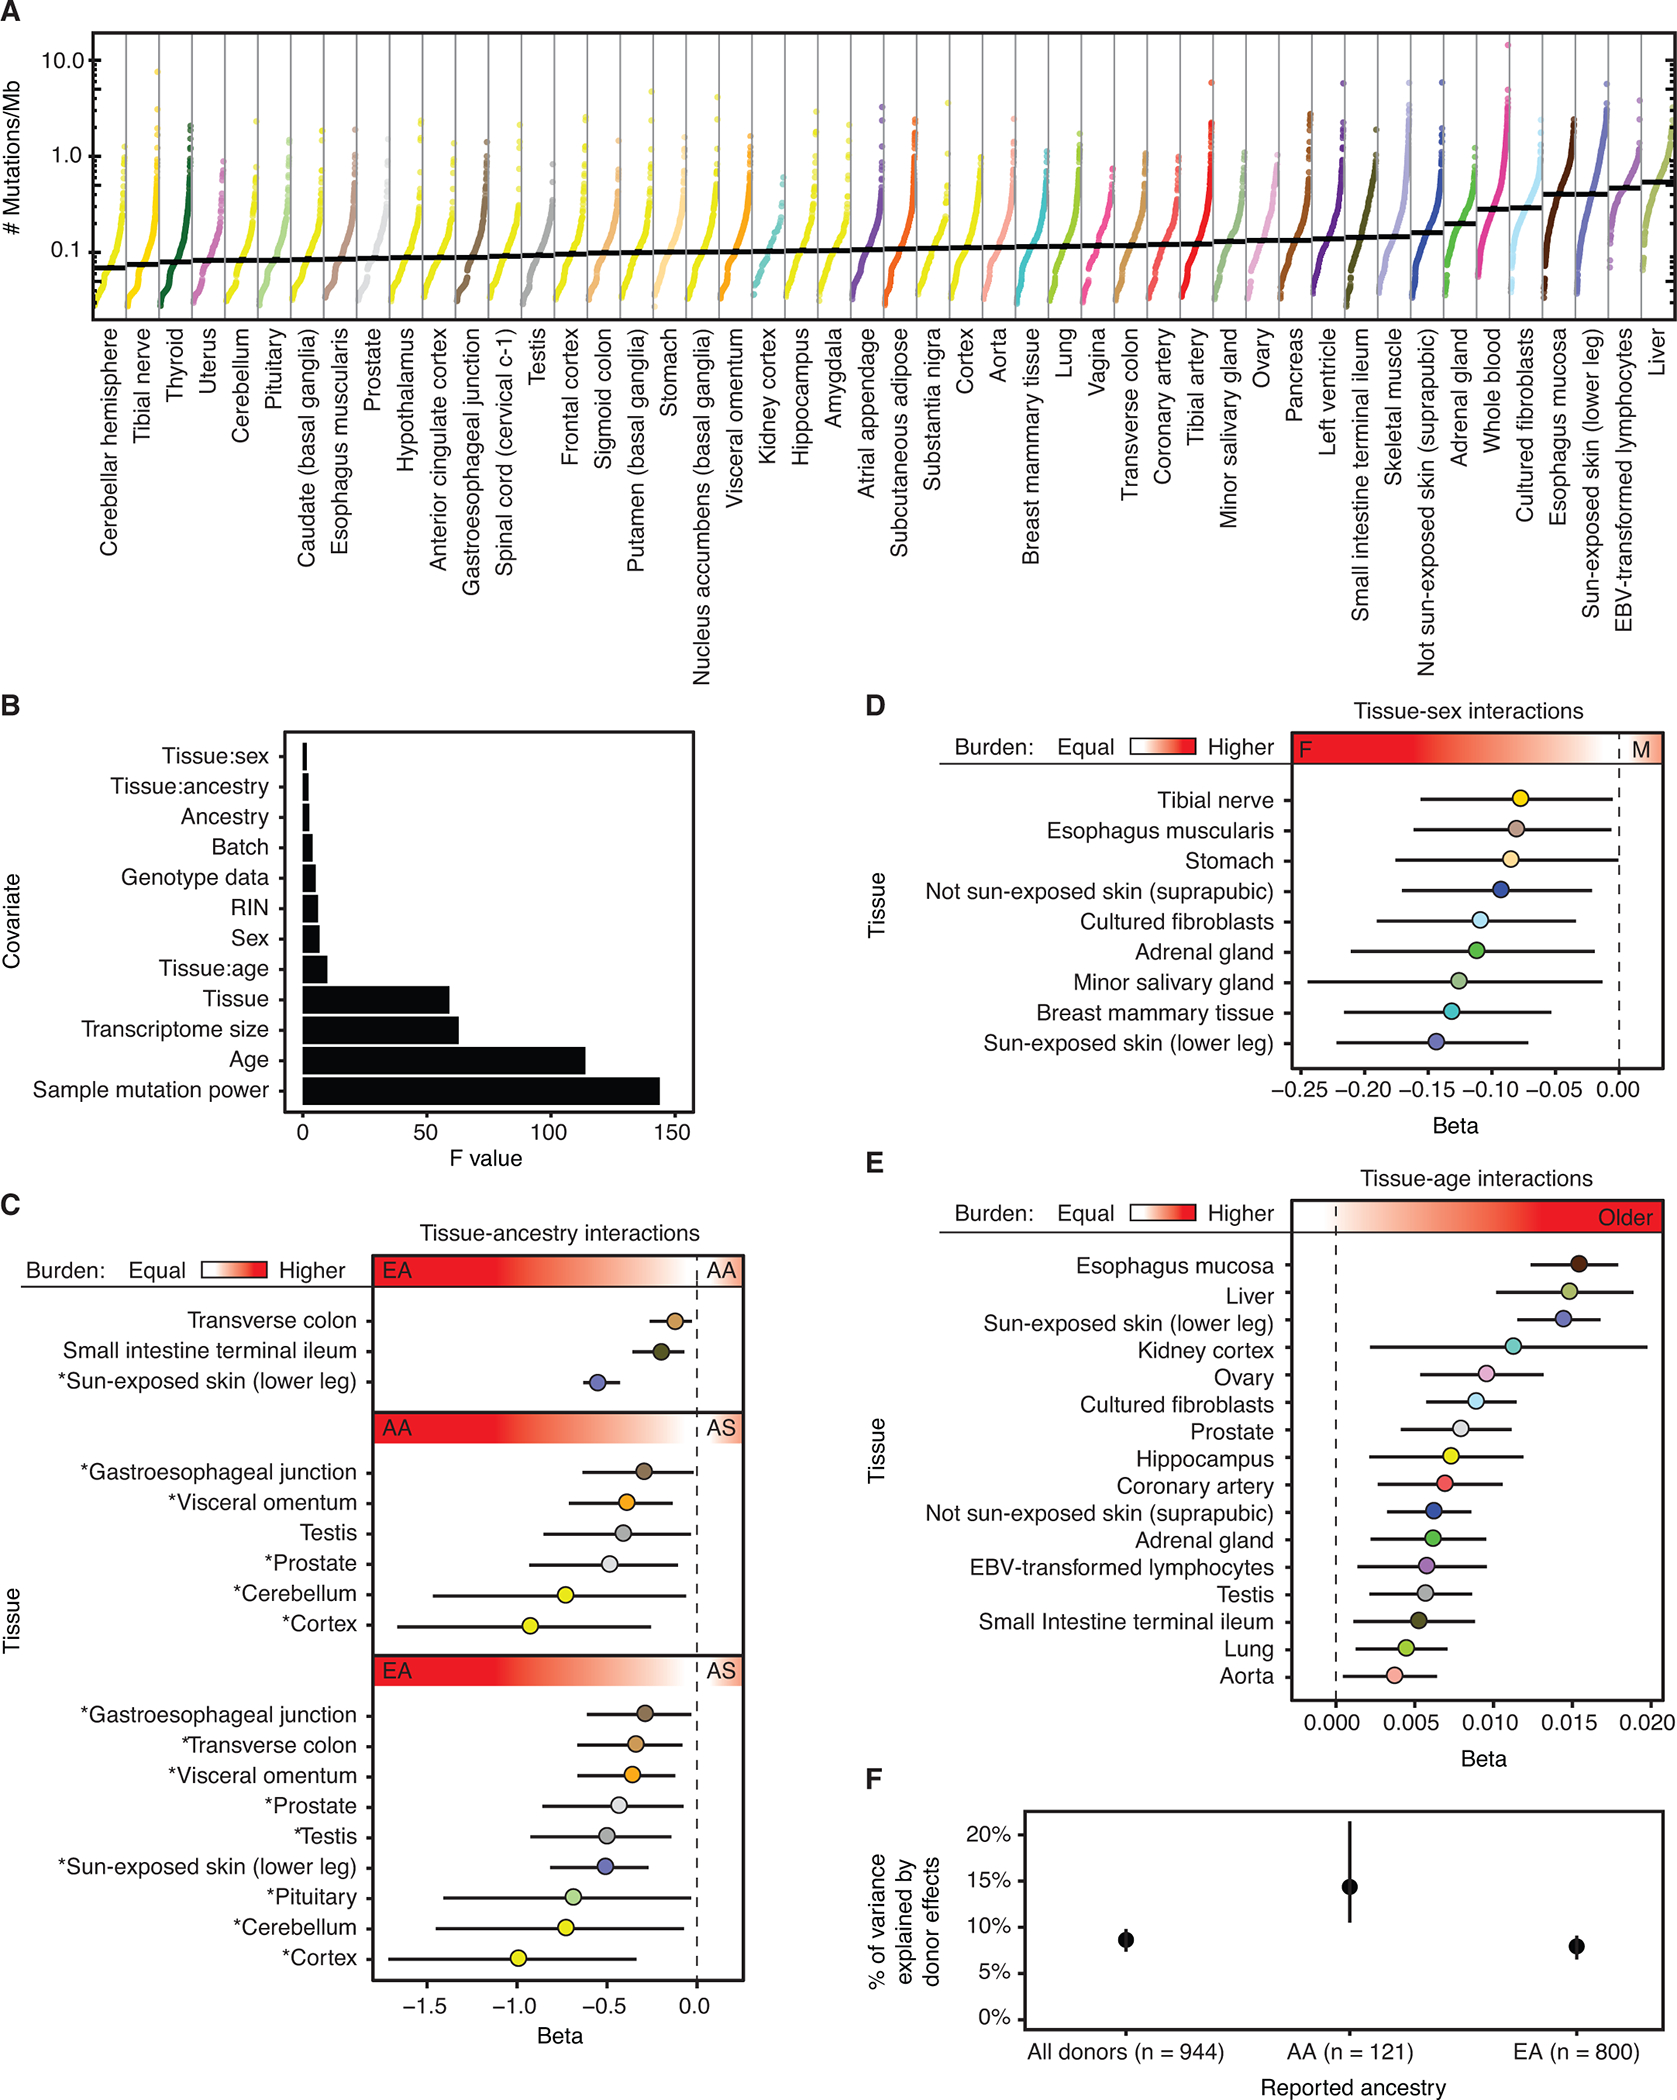
Each datapoint represents a single tissue sample and is colored by tissue. Median normalized PZM burden in a tissue denoted by horizontal black line. Tissues are sorted by increasing median normalized PZM burden. A pseudocount of 1 mutation was added to each sample before normalization and log transformation for visualization. (B) We fit a regression model for single-tissue PZM burden using 12 covariates and 48 tissues. Shown here are the Type II ANOVA F statistics for each covariate in the model. Larger F statistics correspond to greater explanatory power of the covariate. (C) Regression coefficients of tissue-ancestry interactions and (D) tissue-sex interactions indicate strong effects of ancestry and sex on PZM burden. AA = African American. AS = Asian American. EA = European American. * in C denote differences in mutation burden among ancestry groups that are consistent with cancer incidence trends (18) (E) Significant positive tissue-age interaction effects were detected for 16/48 (33%) tissues. In C-E, the red gradient and text labels within indicate the meaning of the regression coefficients’ sign and magnitude. (F) Variance component estimates of donor-specific random effects on PZM burden indicate that 8%−15% of variation among tissues can be ascribed to donor effects, which could be genetic and environmental. Dashed vertical lines at beta = 0 in interaction plots denote no association between mutation burden and interaction. C,D,E,F: Error bars represent 95% CIs. A,C,D,E: Tissues are colored using the GTEx coloring convention (see Table S8 for a complete legend).