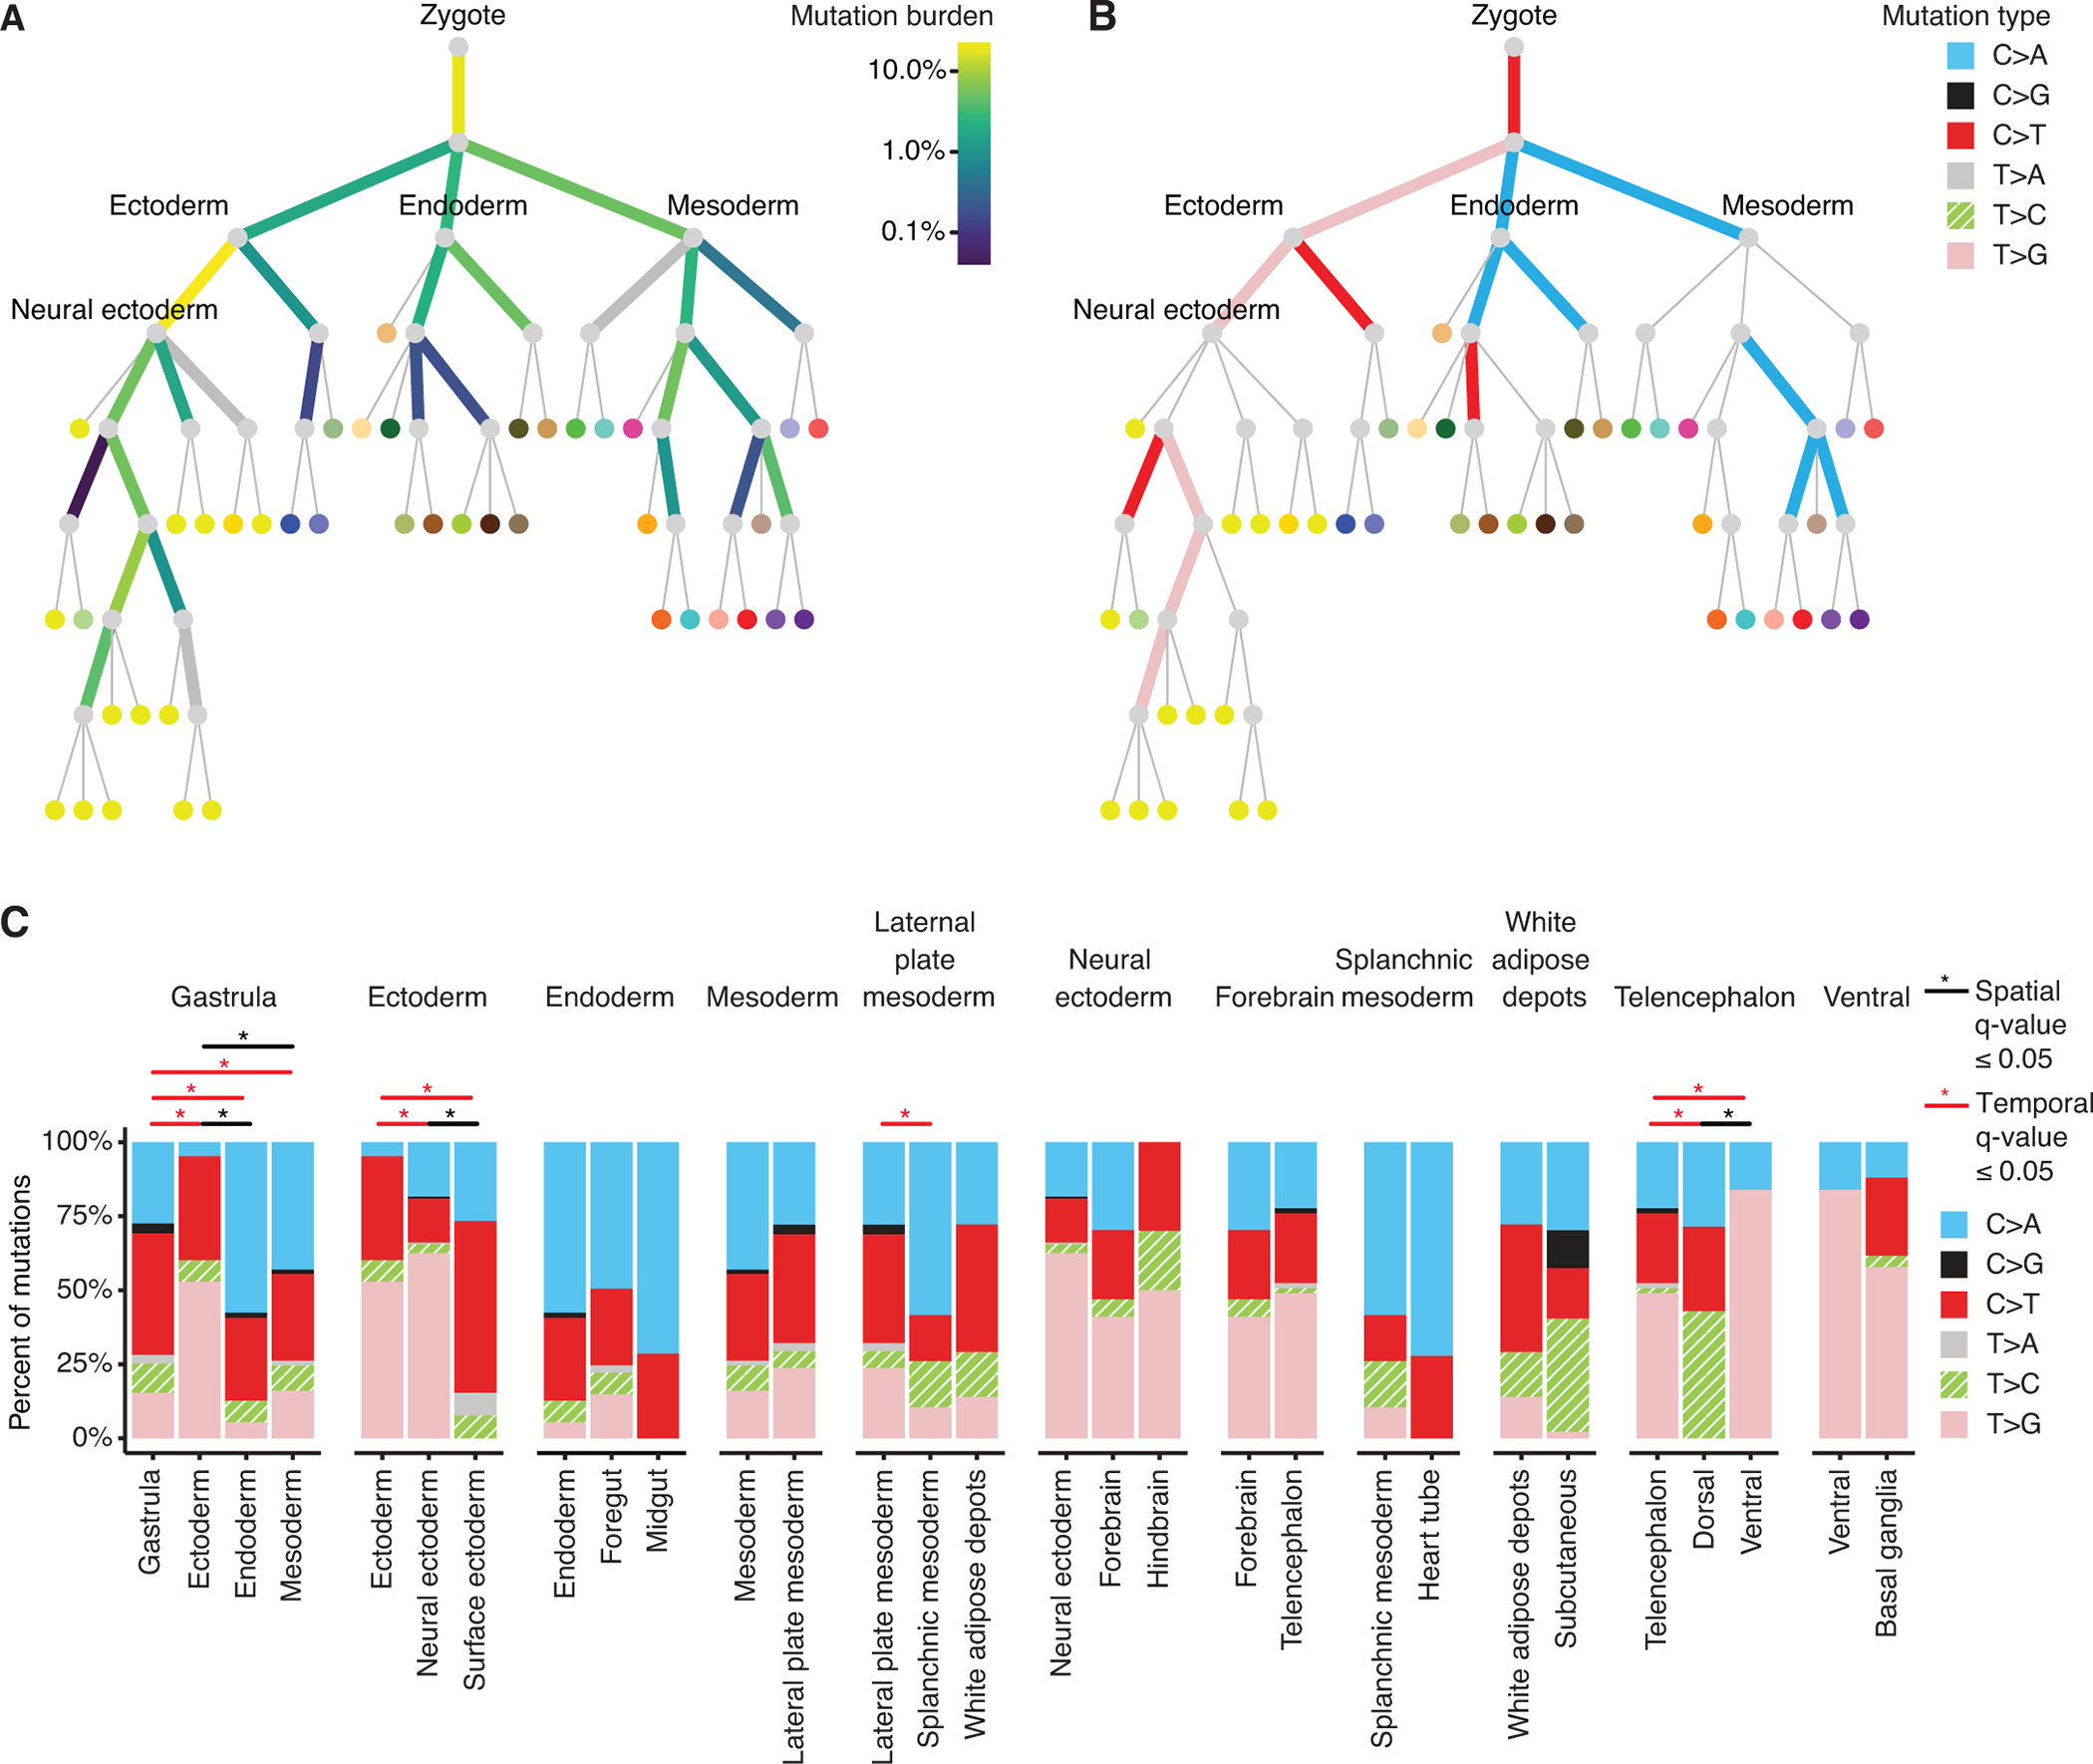
Fig. 2. Mutation burden and spectra of prenatal PZMs across time and space.

(A) Prenatal PZM mutation burden. Edge color represents the percent of prenatal PZMs mapped to that period in development. Thick gray edges are edges with limited mutation detection power. (B) Edge color represents the predominant mutation type of mutations mapped to that edge, as established by binomial testing. Thin gray edges are edges with no predominant mutation type. See Fig. S13A for the full set of vertex labels. Adult tissues (leaves of tree) are colored using the GTEx coloring convention (see Table S8 for a complete legend). (C) Local variation in mutation spectra across developmental space and time. Each facet represents the mutation spectra observed in a parent edge (leftmost barplot) and its children’s edges. Statistically significant differences in mutation spectra are annotated with “*”.
