
Fig. 4. Germ cell PZM characteristics.
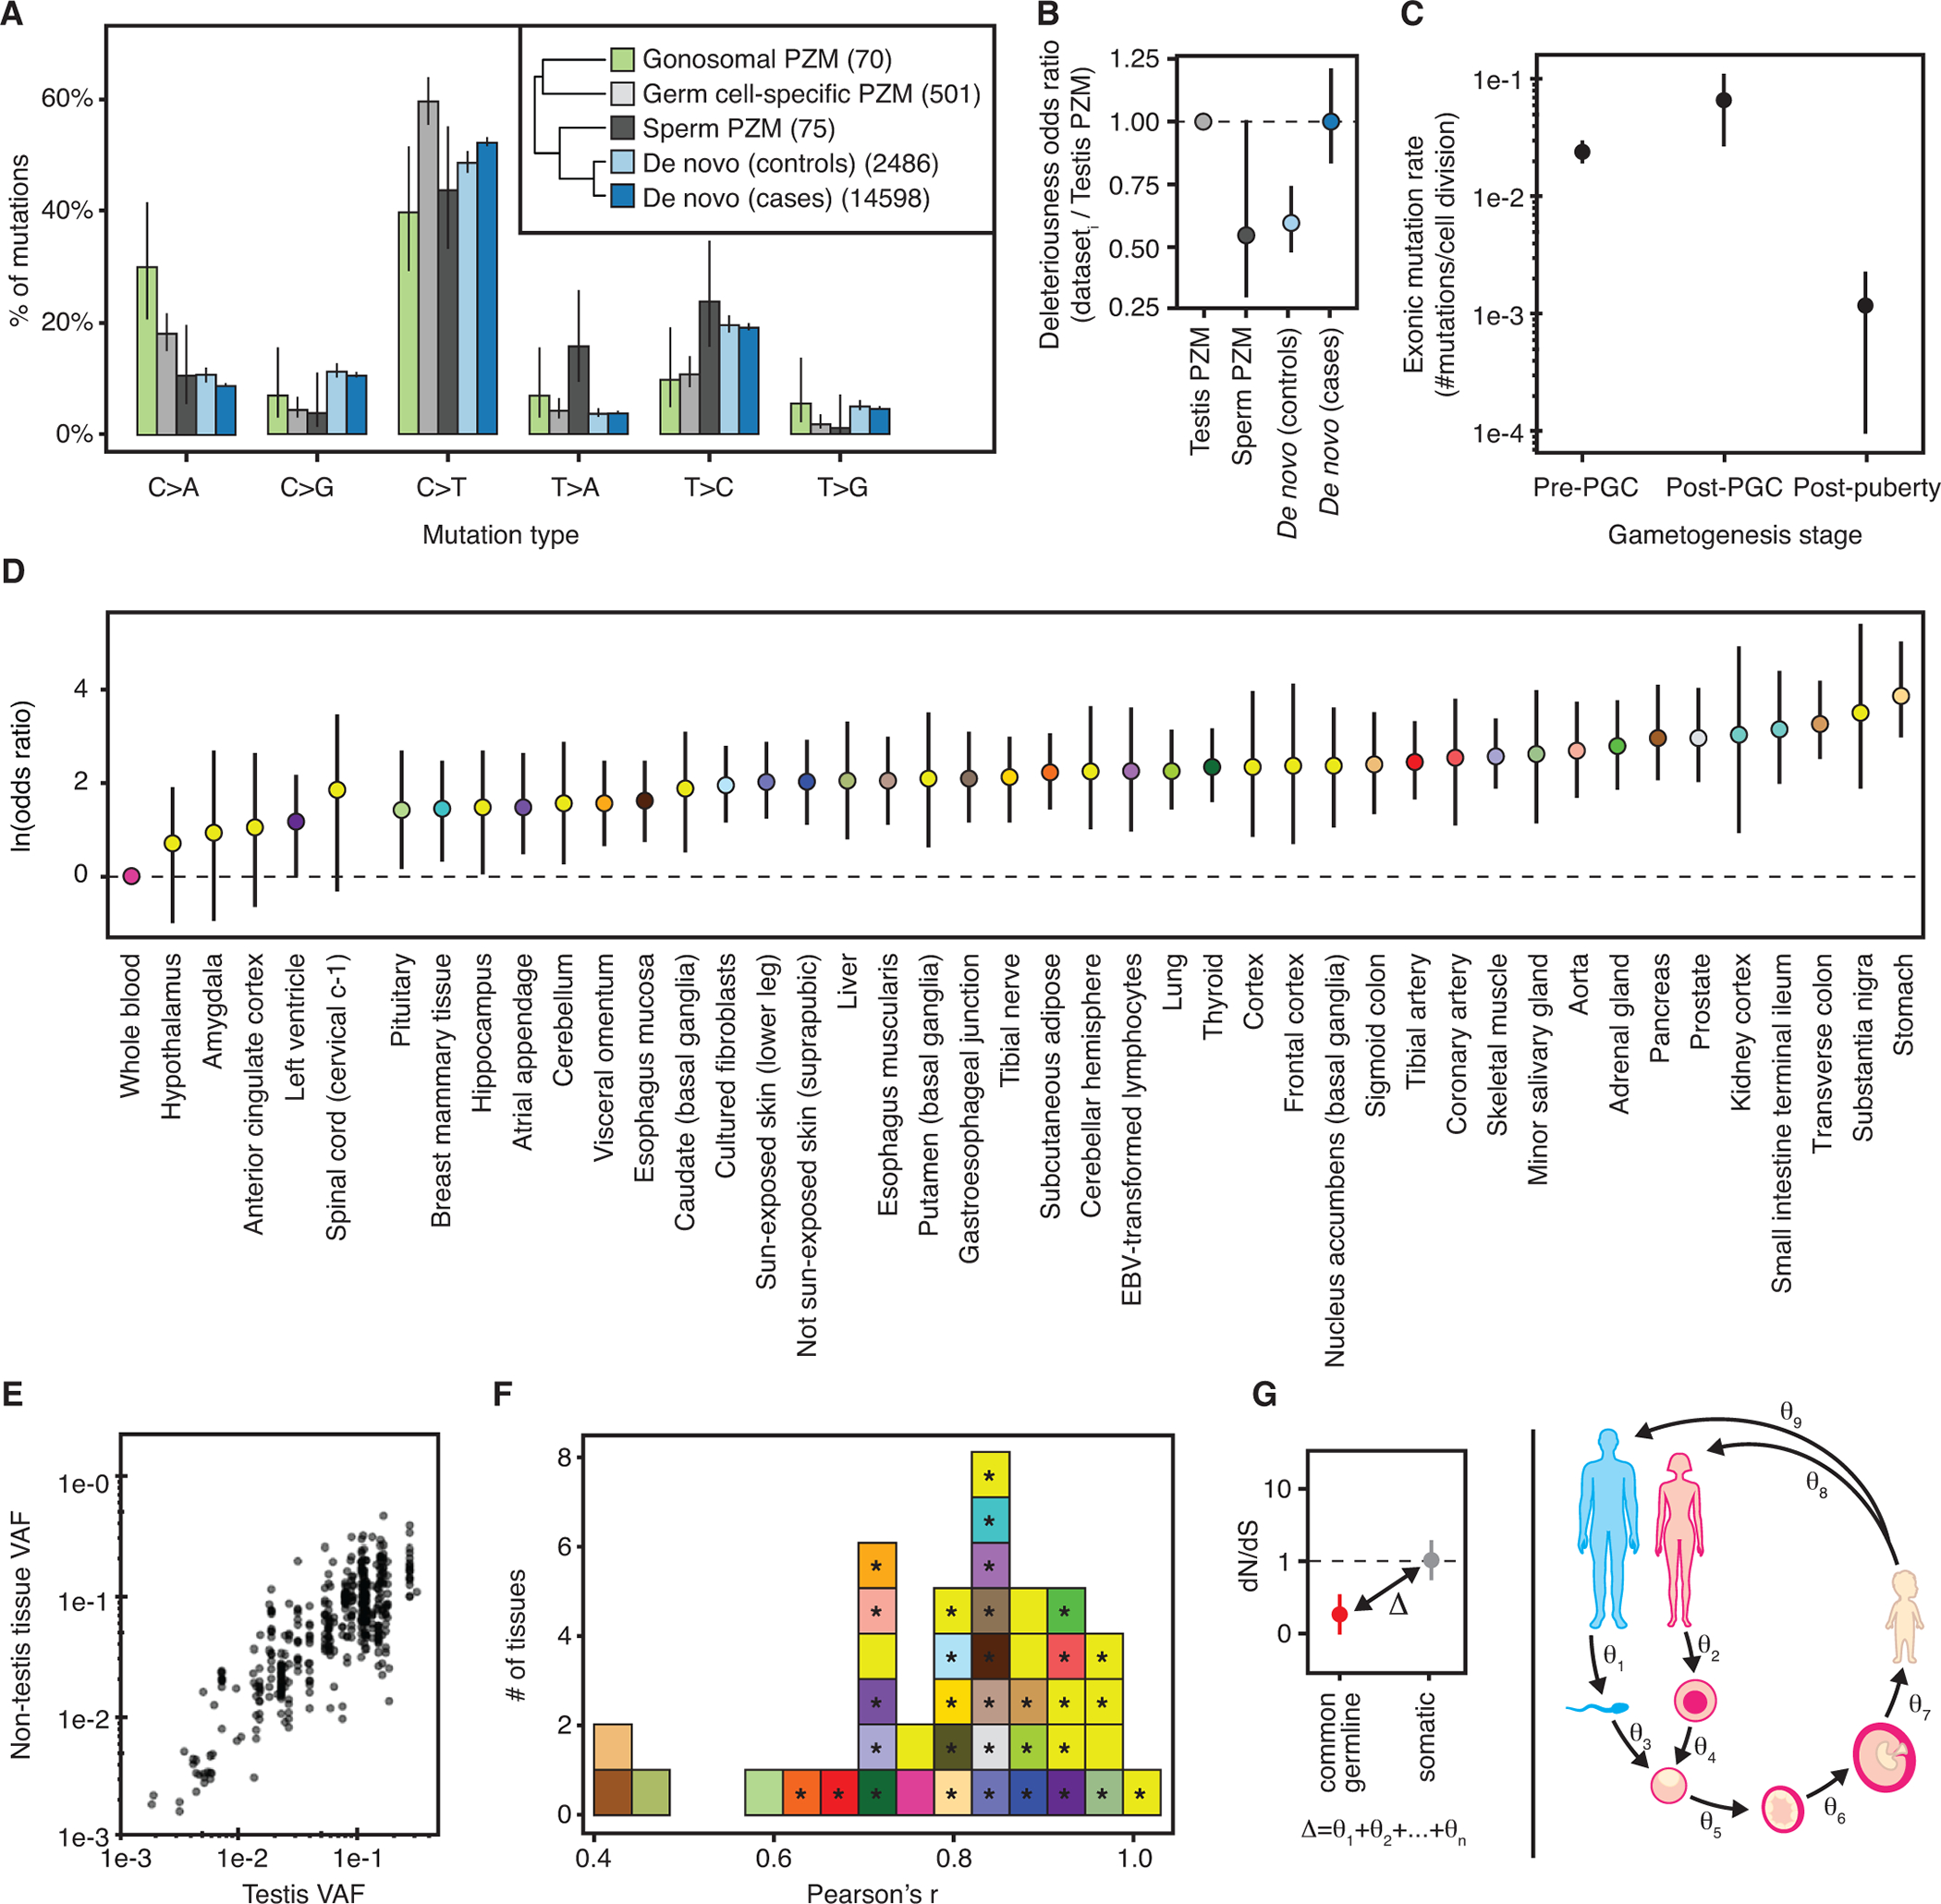
(A) Mutation spectra of different germ cell mutation classes. Number of mutations used in each dataset is listed in the inset. Inset: Hierarchical clustering of germ cell mutation spectra. (B) Relative odds of detecting deleterious mutations across germ cell datasets compared to testis PZMs. Bars colored by dataset. Horizontal black line at odds ratio = 1 denotes no difference in odds. (C) Germ cell mutation rate varies during gametogenesis in males. (D) Majority of somatic tissues have a higher odds of detecting a gonosomal PZM than blood. Natural log odds ratio for detecting a gonosomal PZM in each somatic tissue compared to blood. Dashed line at Y = 0 denotes no difference in odds. (E) Comparison of gonosomal PZM VAF in non-testis tissues versus testis tissue. (F) Distribution of tissue-specific Pearson correlations of log10-transformed gonosomal PZM VAFs in each somatic tissue and testis. Significant correlations at q-value ≤ 0.05 marked with “*”. (G) Schematic of the difference in selective constraint between germline and somatic genetic variation partitioned into discrete stages of the life cycle. A,B,C,D: Error bars denote 95% CIs.