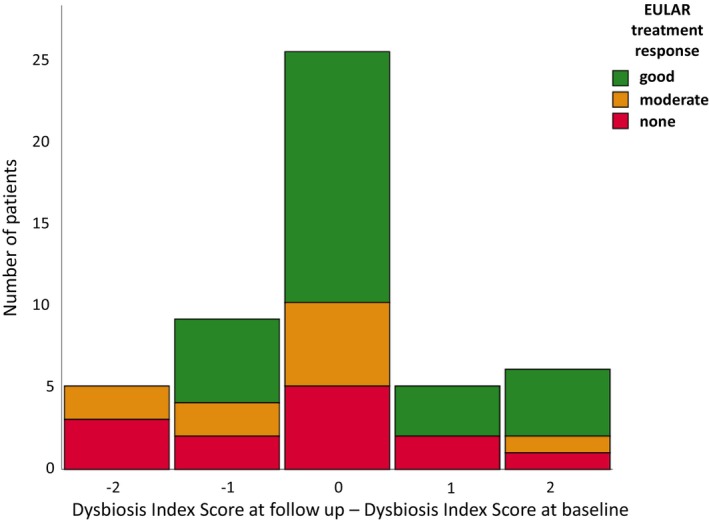
Figure 3.

Histogram of the change in Dysbiosis Index Score at follow‐up. Each bar represents number of patients. Good treatment response could be seen both in patients exhibiting an improvement (negative value on x‐axis) and a worsening (positive value on x‐axis) of the Dysbiosis Index Score at follow‐up.
