Figure 1.
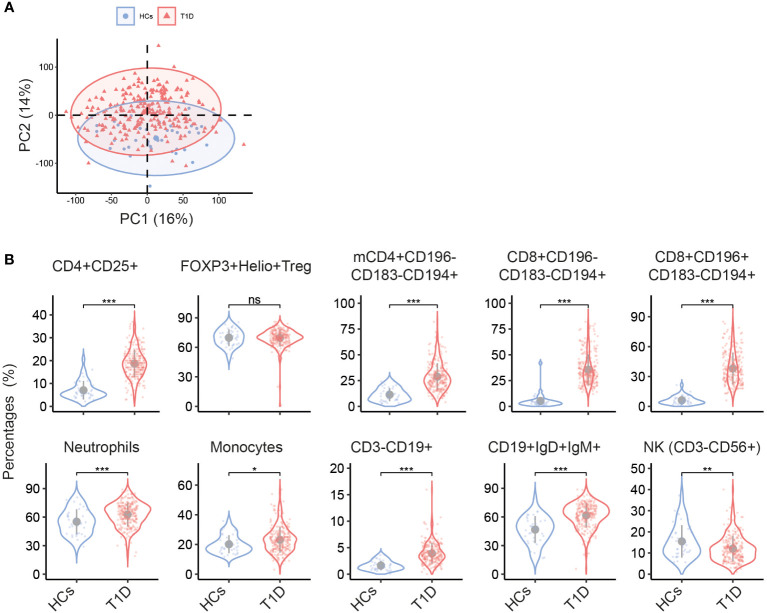
Different circulating immune cell subsets in T1D and HC. (A) Biplot of the first two principal components (PCs) of percentages of immune cell subsets determined by multiparameter flow cytometry. (B) Violin plots show the univariate comparison of cell percentages between T1D (n = 242) and HC (n = 37), adjusted for the covariates age and sex. Each dot represents one individual. Grey dot indicates the mean value, and grey vertical line represents the standard deviation. *, p<0.05; **, p<0.01; ***, p<0.001; ns, not significant. mCD4, memory CD4+ cells.

