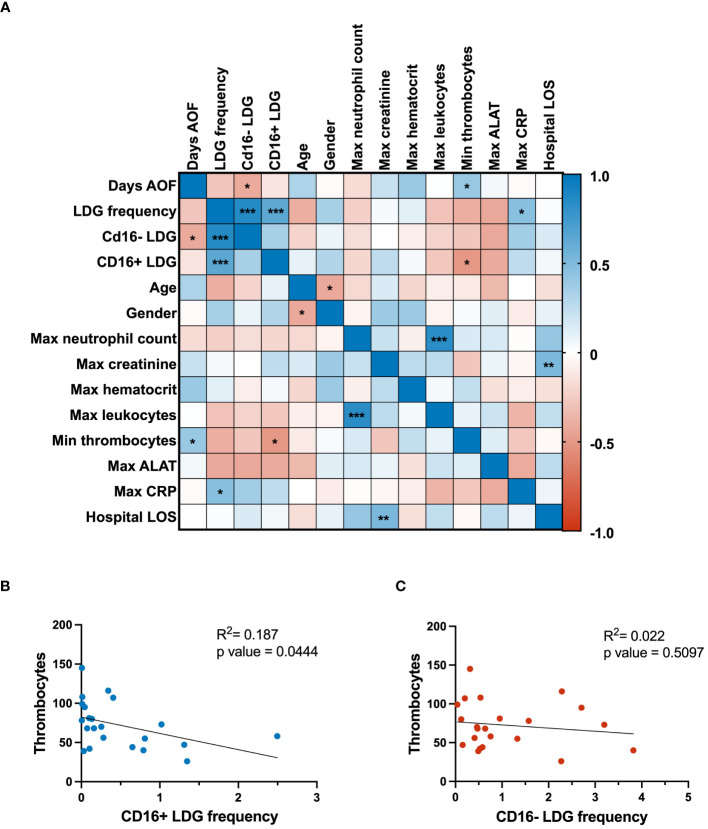
Figure 4.
Clinical correlations and regression analyses. (A) The correlation matrix presents associations among clinical parameters and flow cytometry-measured expression of CD16 marker in LDGs. Positive and negative correlations are denoted by blue and red colors, respectively. Linear regression analyses were conducted to investigate the relationship between thrombocyte levels and the frequency of (B) CD16+ LDGs and (C) CD16- LDGs, as depicted in scatter plots. The p-value for CD16+ LDG regression with thrombocytes was 0.0444, indicating a significant negative association. In contrast, the CD16- LDG regression with the same clinical parameter yielded a p-value of 0.5097, signifying a nonsignificant association with thrombocyte levels. AOF, after onset of fever; LDG, low-density granulocyte; max, maximum; min, minimum; ALAT, alanine aminotransferase; CRP, C reactive protein; LOS, length of stay.

