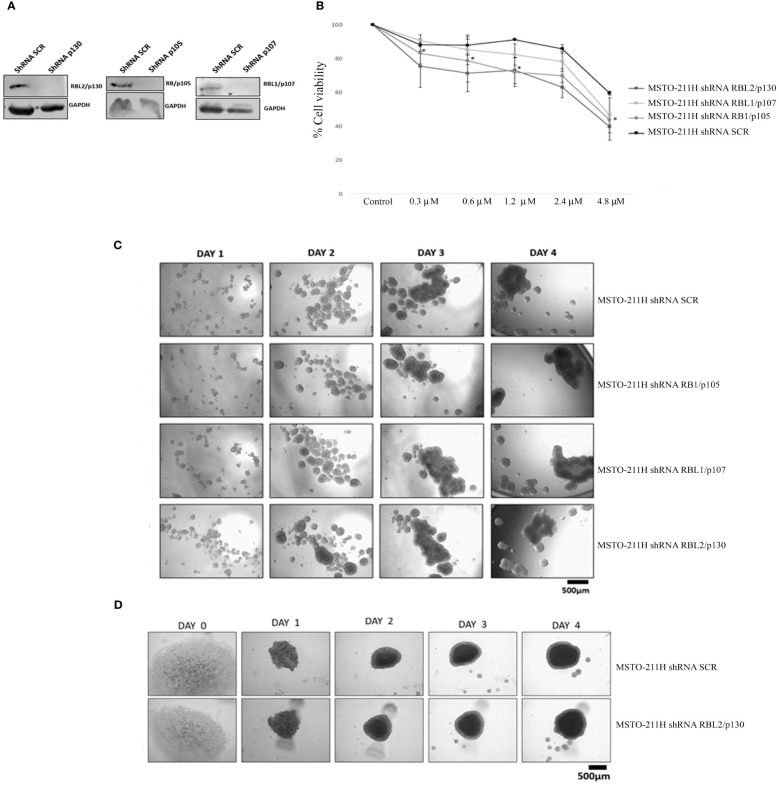
Figure 4.
RB protein family depletion in MSTO-211H cells and abemaciclib response. (A) Western blotting of MSTO-211H cells depleted in each pocket protein generated by shRNA approaches. Expression was assessed by immunoblot with specific antibodies. ShRNASCR are sh-control-transfected cells. (B) The graph represents dose–response growth curves with different doses of abemaciclib (0.3 µM, 0.6 µM, 1.2 µM, 2.4 µM, and 4.8 µM) evaluated by MTS assay after 72 h of treatment in pocket protein-depleted MSTO-211H cells. Statistical analysis was carried out by unpaired Student’s t-test. Statistical significance was settled at *p < 0.05, **p < 0.005 vs. control. Data are presented as mean ± standard deviation expressed as percentages of cell viability (calculated with respect to control cells treated with DMSO alone) of three independent experiments (n = 3). (C) The image represents 4 days’ time-lapse of spheroids with pocket protein depletion in MSTO-211H cells. Cells were seeded at a density of 30 × 104 cells/well in 3 mL of RPMI medium (+10% FBS and +1% l-Glu) in ULA 6-well plates. Images were acquired on days 0, 1, 2, 3, and 4. (D) Cells were seeded at a density of 0.5 × 10⁴ cells/well in U-bottom ULA 96-well plates in 100 μL of RPMI medium (+10% FBS and +1% l-Glu). Images were acquired on days 0, 1, 2, 3, and 4. Scale bar: 500 μm. All experiments were performed at least three times. DMSO, dimethyl sulfoxide; FBS, fetal bovine serum.

