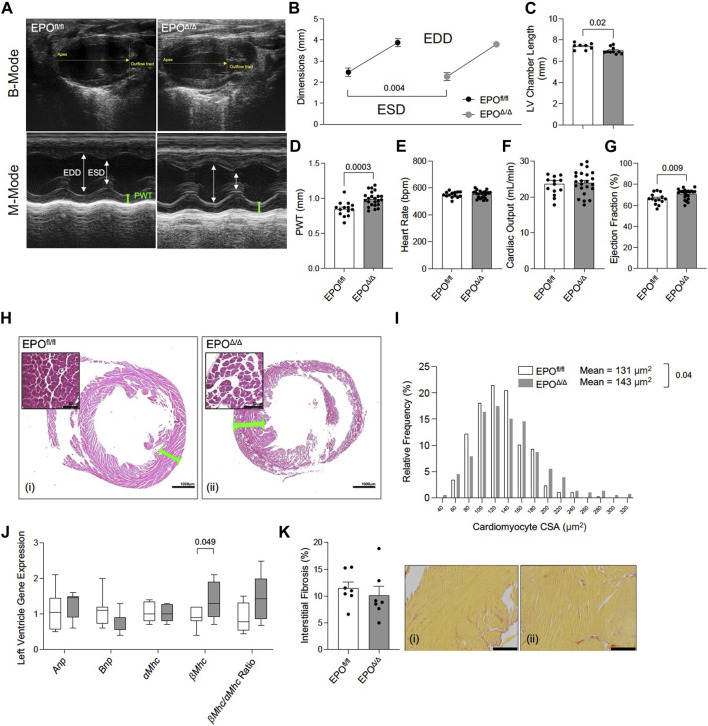
FIGURE 3.
EPOΔ/Δ mice exhibited compensatory changes in cardiac structure and systolic function by echocardiography. (A) Representative B-Mode (top) and M-Mode (bottom) tracings from EPOfl/fl and EPOΔ/Δ mice. Echocardiography measurements included (B) end systolic dimension (ESD) and end diastolic dimension (EDD), (C) left ventricle (LV) chamber length, (D) posterior wall thickness (PWT), (E) heart rate, (F) cardiac output, (G) ejection fraction. (H) Perfusion fixed hearts (representative hematoxylin and eosin histological images from (i) EPOfl/fl and (ii) EPOΔ/Δ hearts–scale bars represent 50µm and 1000 µm) were used to measure differences in (I) cardiomyocyte cross-sectional area (CSA). (J) Expression of fetal genes (atrial natriuretic peptide (Anp), brain natriuretic peptide (Bnp), alpha myosin heavy chain (αMhc), beta myosin heavy chain (βMhc), and βMhc/αMhc ratio) was quantified. (K) Quantification of interstitial fibrosis (%) from (i) EPOfl/fl and (ii) EPOΔ/Δ hearts stained with Picrosirius Red. Scale bar represent 216 µm. An unpaired, two-tailed t-test was used to detect differences. Data are expressed as mean ± SEM (for echocardiography, CSA, and interstitial fibrosis) or mean ± SD (qPCR). Data were considered significant when p < 0.05.

