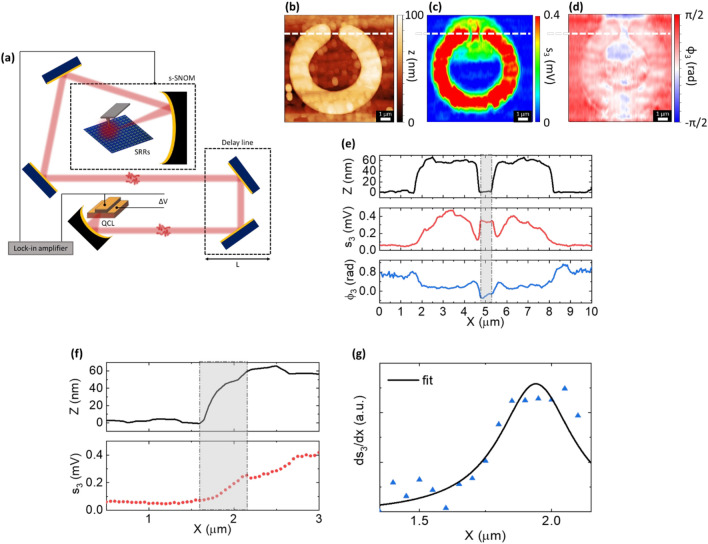
Figure 2.
(a) Schematic of near-field detector-less s-SNOM setup. (b) Topography z, (c) reconstructed near-field amplitude s3 and, (d) phase φ3 images of a single CSRR with SLG embedded in the gap. The self-mixing (SM) signal is demodulated at the 3rd harmonic of the tapping frequency, and the pumping source is a QCL operating at fQCL = 3.0 THz (current IQCL = 370 mA, temperature TQCL = 8.8 K). (e) Line-cut profiles of z, s3 and φ3 extracted along the white line marked in panels (b–d). (f) Evaluation of the spatial resolution of the THz s-SNOM experiment. (g) Lorentzian fit for the line response function (LRF) correspondent to the grey-shaded X interval in (f).

