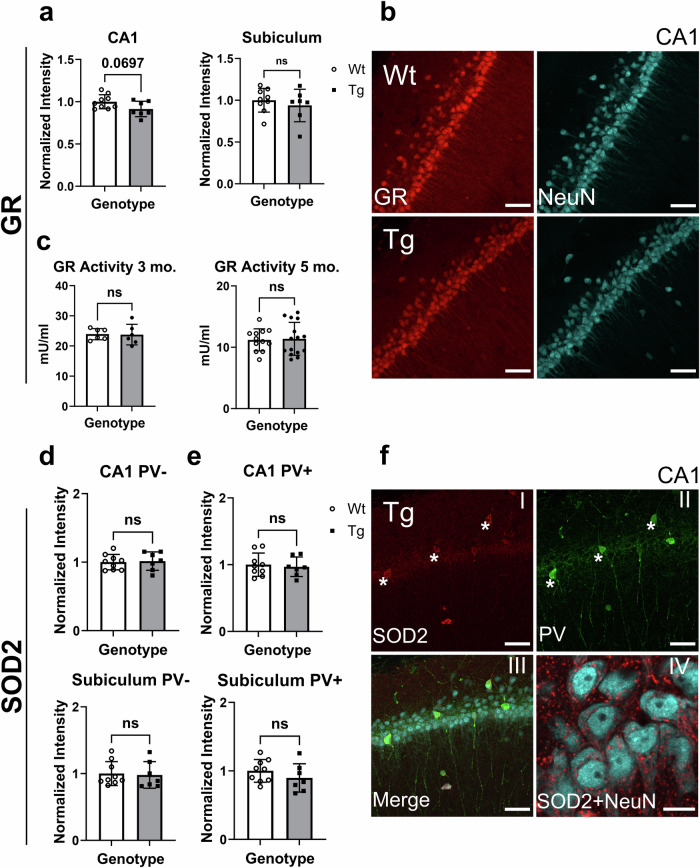
Fig. 3. Protein levels of GR and SOD2 in hippocampal neurons.
a Quantification of GR immunoreactivity in CA1 and subiculum neurons of Wt and Tg rats normalized to Wt fluorescence intensity. n = 9 (Wt), n = 7 (Tg). b Representative images of GR immunoreactivity (red) in Wt and Tg CA1 neurons with NeuN in cyan. c Enzyme activity of GR in 3-month (n = 6 (Wt), n = 6 (Tg)) and 5-month-old (n = 12 (Wt), n = 15 (Tg)) Wt and Tg cortical homogenates. d Quantification of SOD2 immunoreactivity in CA1 and subiculum neurons of Wt and Tg rats that had no parvalbumin (PV-) immunoreactivity. Values were normalized to Wt fluorescence intensity. e Quantification of SOD2 immunoreactivity in CA1 and subiculum of Wt and Tg PV+ neurons normalized to Wt fluorescence intensity. n = 9 (Wt), n = 7 (Tg). f Representative CA1 images of a Tg rat showing SOD2 immunoreactivity in red (I), PV+ neurons in green indicated by asterisks (*) (II), merged with NeuN in cyan (III). A higher magnification image of SOD2 (red) and NeuN (cyan) in CA1 (IV). Error bars represent SD. Scale bars represents 50 µm in B, F (I-III) and 10 µm in F (IV). ns = non-significant, two-tailed t-tests.

