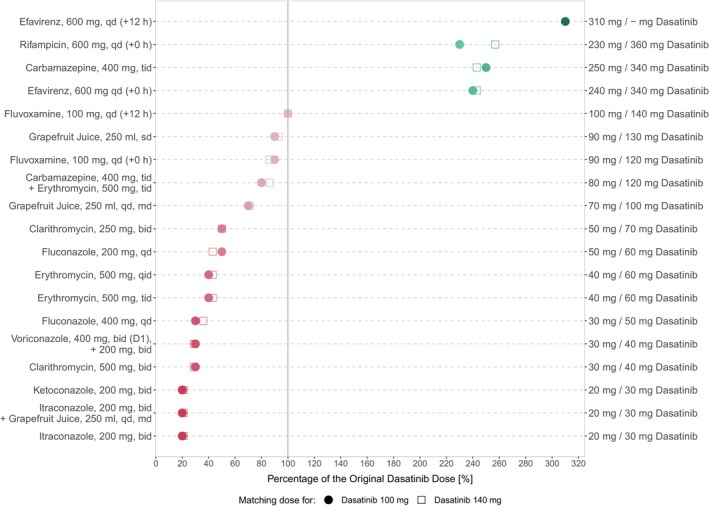
FIGURE 7.

Overview of model‐based dose adaptations for dasatinib within single and multiple DDI scenarios based on the exposure matching principle, where points and squares show the percentage of the original dasatinib dose that match the PBPK simulated monotherapy AUCss at 100 mg and 140 mg, respectively. A virtual European male individual, 64 years of age and default values for body weight and height according to the International Commission on Radiological Protection (ICRP) database, was used for the dosing simulations. Red symbols depict dasatinib dose reductions and green symbols depict dasatinib dose elevations. The darker the color, the higher the magnitude of dasatinib dose adaptation. –, dose adaptations outside the simulated dose range; AUCss, steady‐state area under the concentration–time curve; bid, twice a day; D, day; md, multiple dose; qd, once daily; qid, four times a day; sd, single dose; tab, tablet; tid, three times a day.
