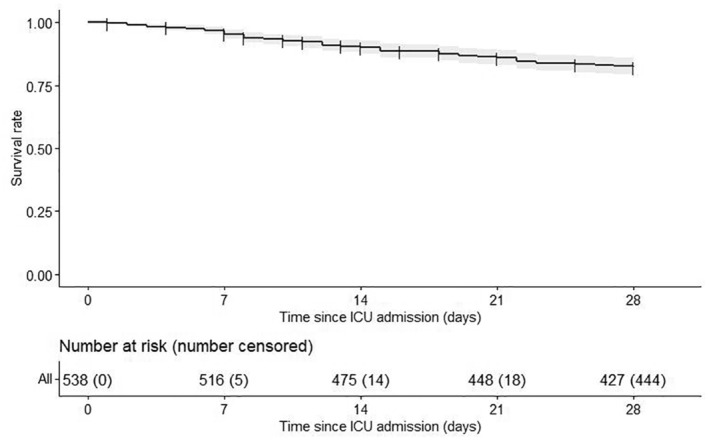
FIGURE 2.

Kaplan–Meier of the overall survival until Day 28 (D28). The gray area around the survival curve represents the associated 95% confidence interval (95% CI). The numbers of patients at risk and the cumulative numbers of censored patients along time are displayed under the plot.
